The MiaProva Chrome Extension grows into Adobe Experience Platform
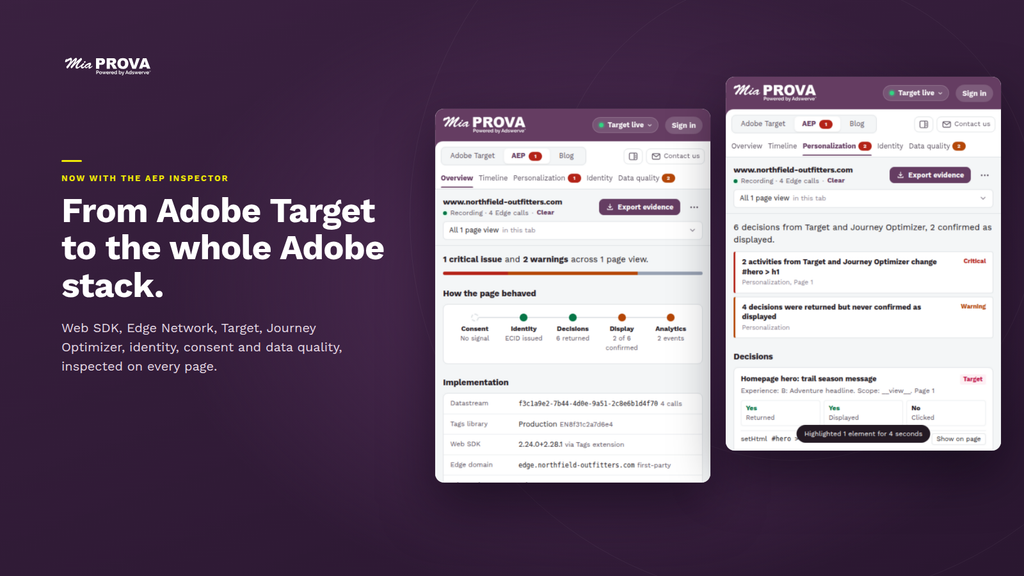
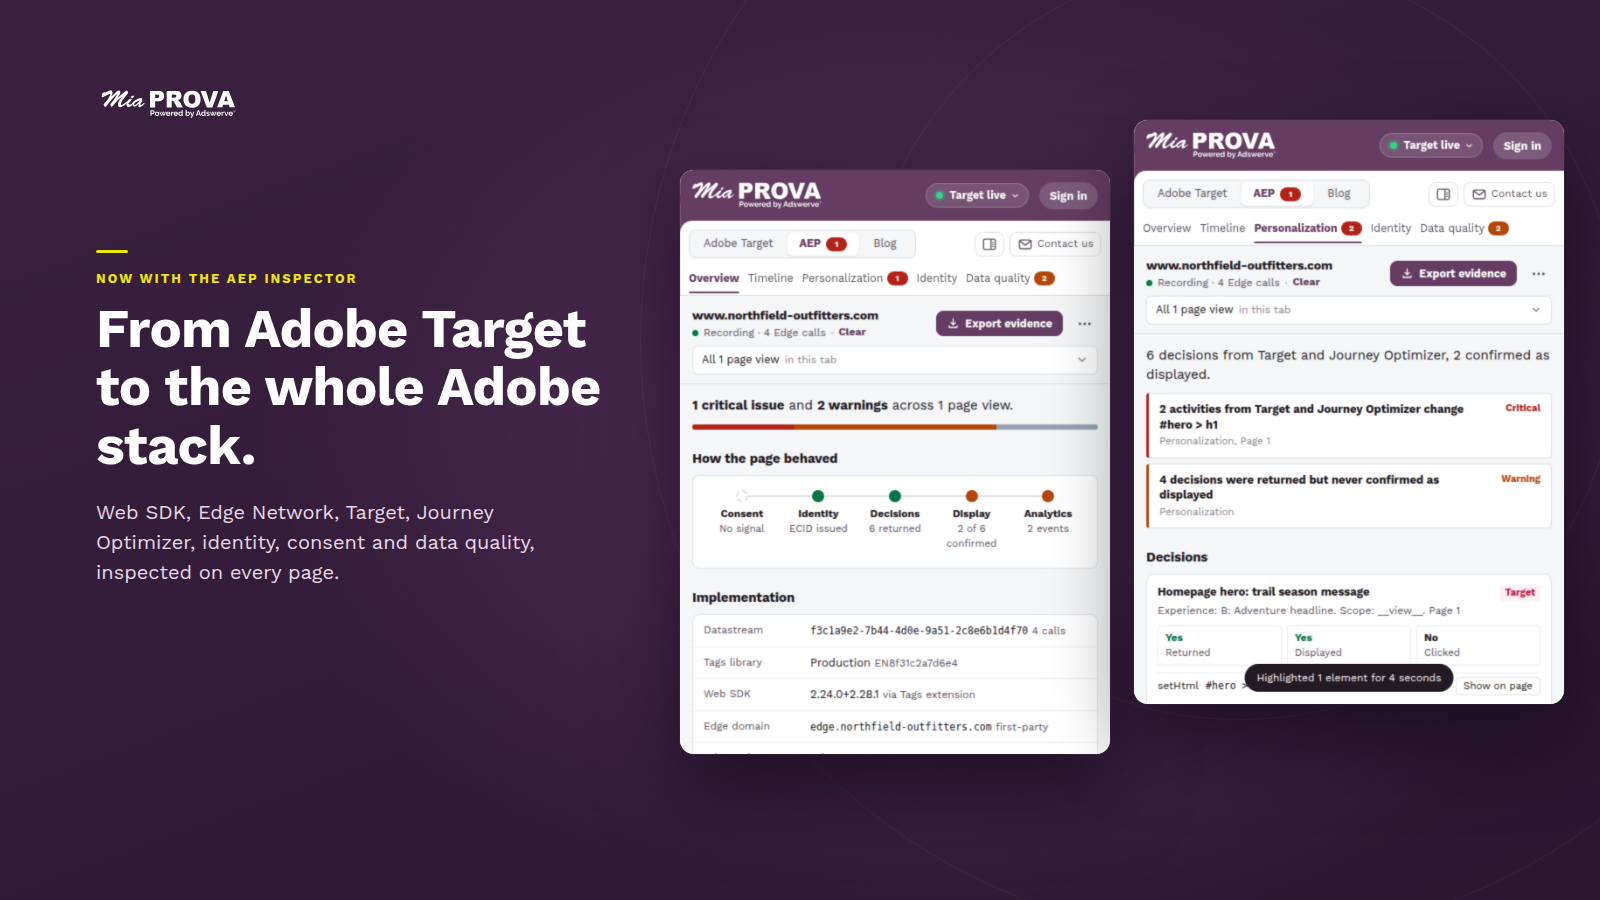
From Adobe Target to the whole Adobe stack
The MiaProva Chrome Extension now inspects your Adobe Experience Platform implementation, not just Adobe Target. The same move is happening across the MiaProva application, which is growing from optimization program management into AEP governance.
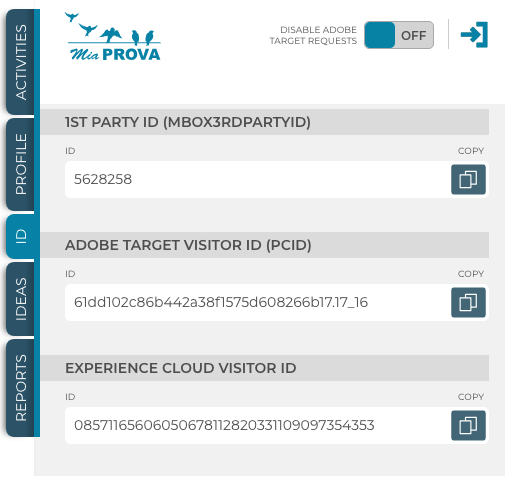
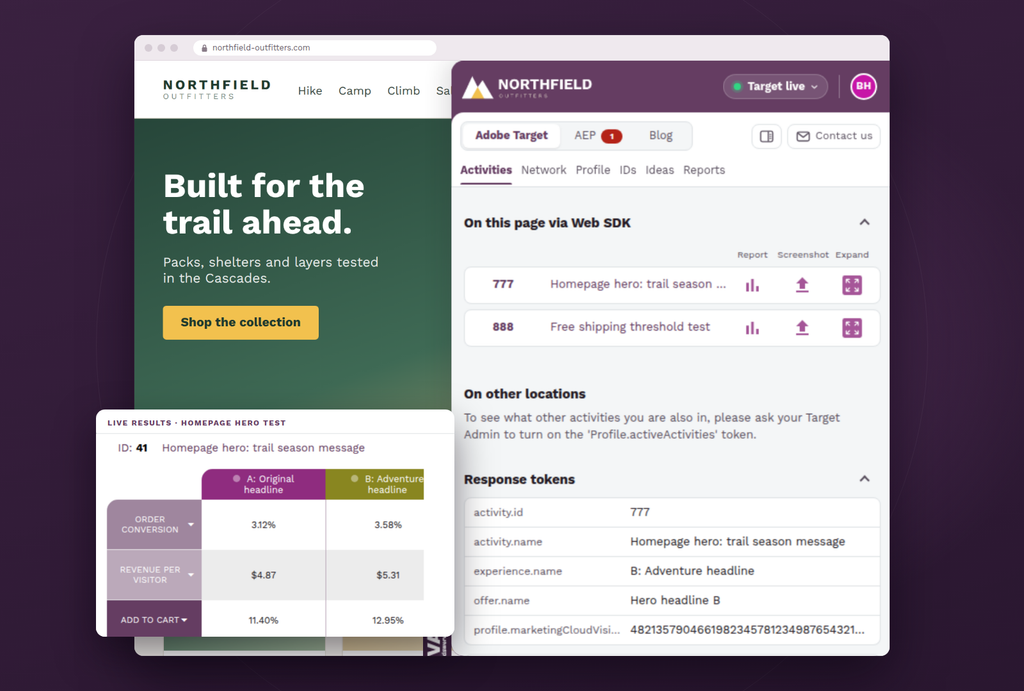
For years, the extension answered one question well: what is Adobe Target doing on this page? Practitioners used it to see which activities and experiences they were in, read response tokens, check their visitor IDs and, as MiaProva customers, pull up test results in context.
That question has grown. Most Adobe customers are moving to the AEP Web SDK and the Edge Network, where one call can carry analytics, identity, consent and personalization at once. Target now shares the page with Adobe Journey Optimizer, and the data you collect feeds Real-Time CDP and Customer Journey Analytics as well as Adobe Analytics.
So the extension grew with it. The new AEP Inspector reads the Adobe traffic a page already sends and explains what happened, in plain language, with the evidence to back it up. It needs no Adobe login and no changes to your site.
What’s new at a glance
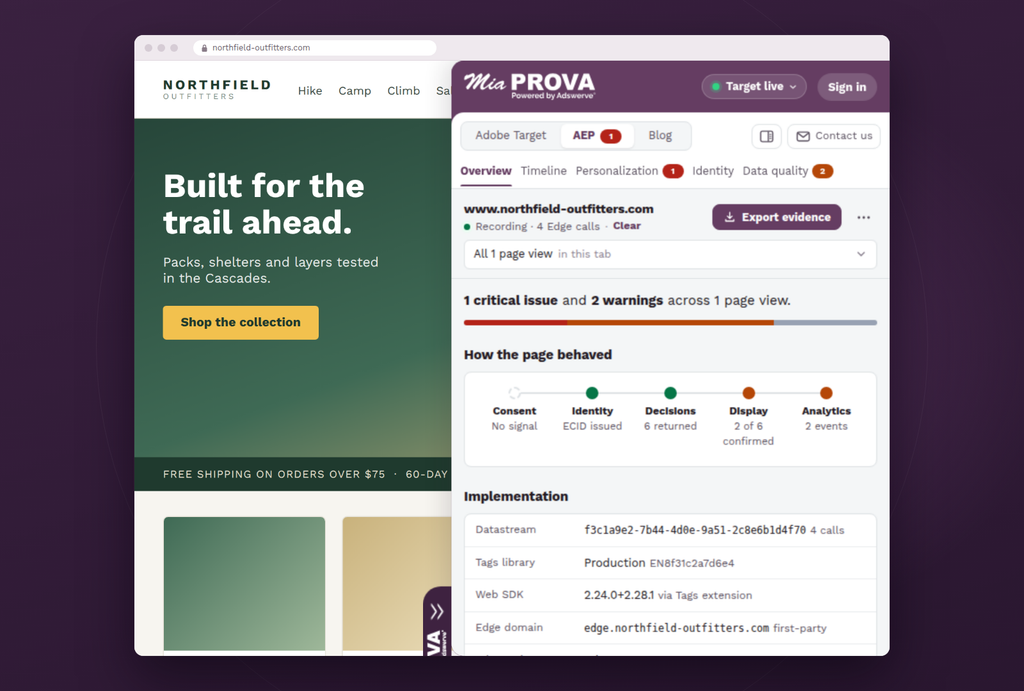
Open the extension on any page and you now choose between three sections: Adobe Target, the views you already know; AEP, the new inspector; and Blog. The AEP section is organized around the questions practitioners ask most:
- Overview: how the page behaved across consent, identity, decisions, display and analytics, plus an implementation fingerprint and every finding, ranked by severity.
- Timeline: every Adobe call on the page, in order. Expand any call in place to read its payload without losing your place.
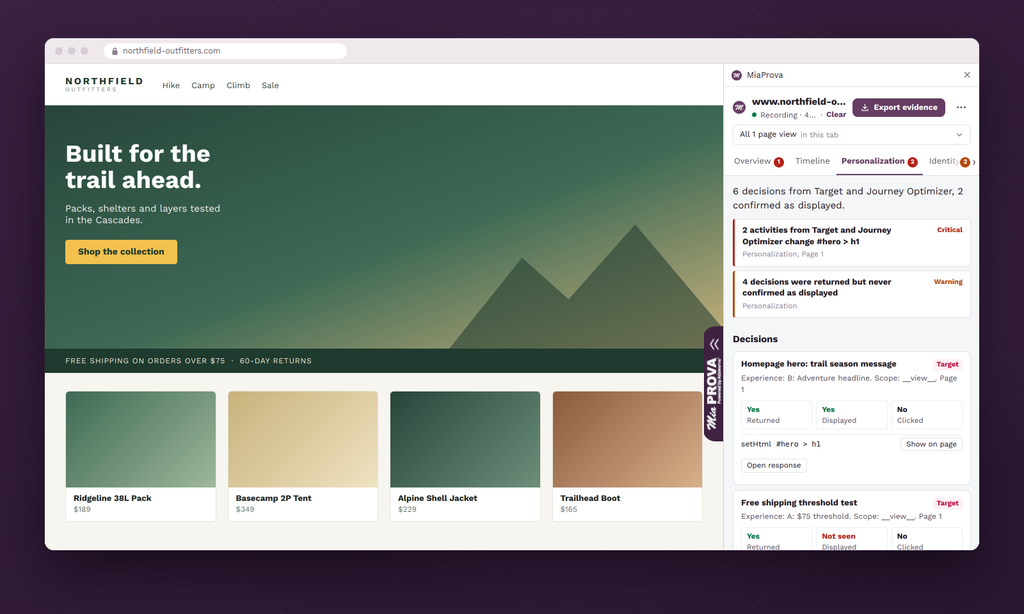
- Personalization: Adobe Target and Journey Optimizer decisions, from fetch to display.
- Identity: the Experience Cloud ID, the identities you send and the visitor’s consent over time.
- Data quality: the problems that quietly distort reporting, plus rules you define for your own implementation.
When you want more room, open the inspector in Chrome’s side panel. It stays with the tab you opened it for while you keep browsing. And when you need to hand something to a developer or an agency, Export evidence packages the findings, the calls behind them, screenshots and your notes, with personal data masked.
Features by Adobe product
The inspector checks each Adobe product on the page, and the connections between them, which is where the hardest problems usually hide.
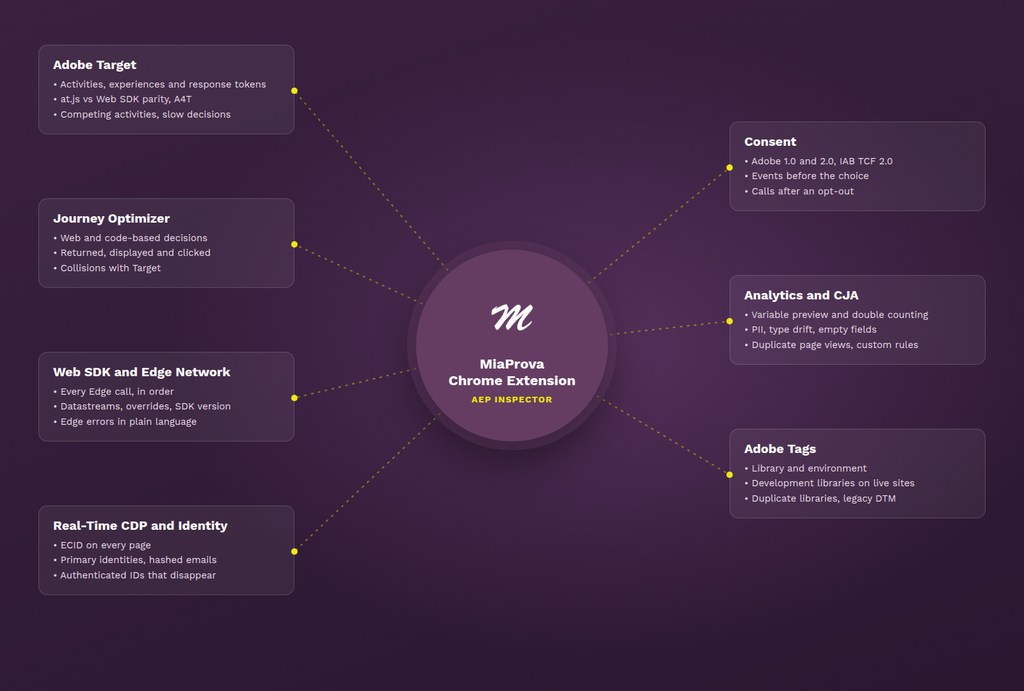
Adobe Target
- The activities and experiences you are in on each page, delivered by at.js, mbox.js or the Web SDK, with their response tokens.
- Content highlighting, so you can see exactly what an activity changed.
- Warnings when activities compete for the same element, including a clear note when that element is the page head, where several activities are normal for form-based and custom-code activities.
- at.js and the Web SDK compared side by side: latency, locations, parameters and Analytics for Target (A4T).
- Checks for missing display notifications, slow or repeated decision requests, missing response tokens and mbox3rdPartyId mapping.
- A switch to turn Target off for the current tab, so you can compare against the default experience.
- For MiaProva customers: live results with lift and confidence, test ideas submitted in context, and page screenshots captured straight into a test ticket.
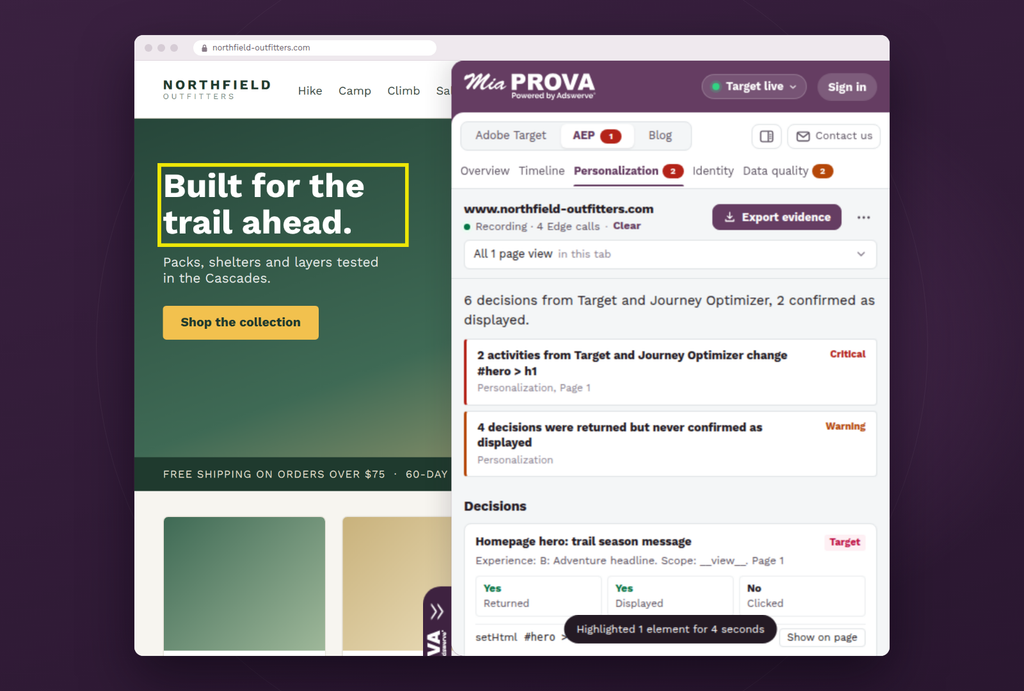
Adobe Journey Optimizer
- Web and code-based decisions shown next to Target’s, with whether each was returned, displayed and clicked.
- Show on page, which outlines the element a decision changes.
- A critical warning when Journey Optimizer and Target change the same element on the same page.
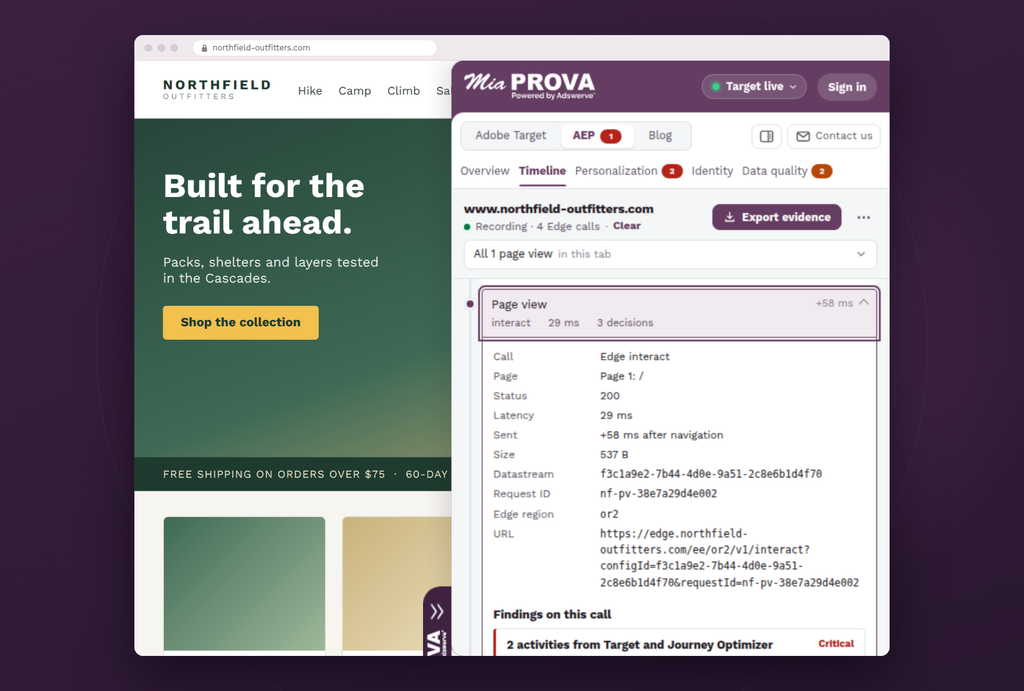
AEP Web SDK and Edge Network
- A timeline of every Edge call. Expand any call to read its XDM, response handles, cookies and the findings attached to it.
- An implementation fingerprint: datastream, runtime overrides, Web SDK version and deployment, edge domain and region.
- Edge errors and warnings translated into plain language, with what to do next.
- Checks for multiple datastreams, overrides, outdated Web SDK versions and more than one SDK instance.
Real-Time CDP and Identity Service
- The Experience Cloud ID (ECID) on every page, with a warning when it changes between pages.
- identityMap checks: missing or multiple primary identities, plain-text or badly hashed emails, and authenticated IDs that disappear.
- A flag when the legacy Visitor ID service still runs alongside the Web SDK.
Consent
- A consent timeline across Adobe Consent 1.0 and 2.0 and IAB TCF 2.0, decoded into readable purposes.
- Warnings for events sent before the visitor’s choice arrived, and for Edge calls, legacy tags or personalization after an opt-out.
Adobe Analytics and Customer Journey Analytics
- A preview of how Web SDK events map to Analytics variables, next to AppMeasurement hits on the same page.
- Double-counting detection when AppMeasurement and the Web SDK both collect.
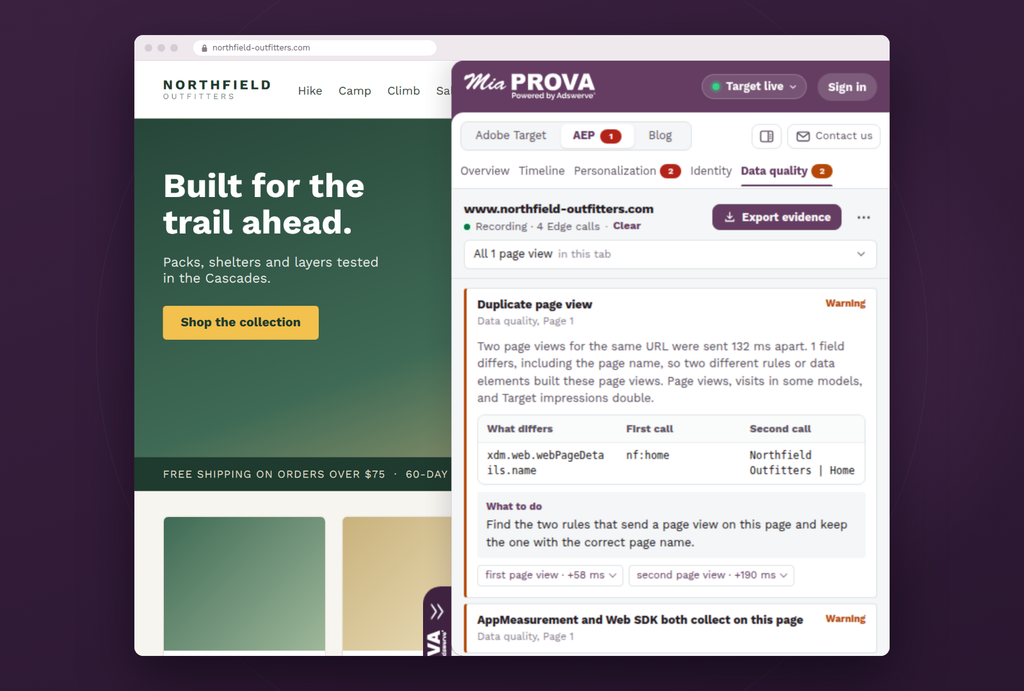
- Data quality checks on the XDM that feeds your AEP datasets and Customer Journey Analytics: personal data in any field, type changes, missing event types, empty fields and oversized payloads.
- Duplicate page view detection that compares the two calls field by field, so you know whether it’s one rule firing twice or two different sources.
- Custom rules for your own implementation contract, such as “purchases carry an order ID”, shareable with your team as a file.
Adobe Tags
- The Tags library and environment on each page, with a critical warning when a development or staging library runs on a live site.
- Flags for duplicate libraries and legacy DTM.
What Adobe practitioners will value most
We built the inspector around the moments that cost practitioners the most time. Five stand out.
Answers, not payloads. Debugging the Web SDK usually means reading raw JSON in DevTools and knowing what to look for. The inspector does that reading for you and says what it found in plain language: “Decisions took 1,810 ms to return”, “The ECID changed between page views”. The raw payload is still one click away when you need it.
Problems between products. The costliest issues rarely live inside one product. A Target activity and a Journey Optimizer campaign fight over the same banner. AppMeasurement and the Web SDK both count the same page view. An event fires before consent arrives. Seeing the whole stack in one place is what makes these visible.
Severity you can prioritize. Every finding is rated critical, warning or informational, with a short “what to do” and links to the exact calls behind it. Your team can triage in minutes instead of arguing over whether something matters.
Evidence that travels. A screenshot of DevTools rarely convinces anyone. An evidence export carries the findings, the calls, your notes and screenshots, with emails masked, IDs hashed and cookies removed by default. Drop it into a ticket, a QA sign-off or a conversation with your agency.
No access required. The inspector works from what the page sends, so anyone on the team can use it on any site: a developer, a QA analyst, a consultant reviewing a prospect’s implementation. Nobody needs an Adobe login or admin rights to see what is going on.
Use cases
Migrating from at.js or AppMeasurement to the Web SDK
Migrations fail quietly: a parameter that never made it across, page views counted twice during the overlap, A4T that stopped linking. Open the inspector on the pages you’re migrating and compare at.js and the Web SDK side by side. It flags double counting between AppMeasurement and the Web SDK, and shows the Analytics variables your Web SDK events will populate before you switch.
QA before a release
Before a Tags publish or a site release, walk the key pages with the inspector open. Load the starter rules, add your own (“checkout page views carry a cart ID”), and watch pass and fail results update as you go. Export the evidence pack as your QA record.
Why didn’t my test show?
A stakeholder says the new experience never appeared. The Personalization view shows whether Target or Journey Optimizer returned a decision, whether it was displayed, how long it took, and whether another activity changed the same element first. Show on page outlines what should have changed.
A consent and privacy audit
The Identity view’s consent timeline shows the visitor’s choice as it happened, decoded from Adobe consent standards and IAB TCF. The inspector flags events sent before that choice arrived and any Adobe calls after an opt-out. The Data quality view flags email addresses or phone numbers in any field, including page URLs.
Governance across teams
When several teams and agencies touch one site, collisions and duplicates creep in. The inspector catches competing activities, duplicate page views and development Tags libraries running live. Shared rule sets let every team check against the same implementation contract.
Onboarding a new account
For consultants and new team members, the Overview’s implementation fingerprint is a fast orientation: which datastreams, which Web SDK version, first-party or Adobe edge domain, Tags environment, and legacy libraries still present.
How it works, and what stays private
The inspector watches the requests a page already makes to Adobe and reads the responses as they arrive. It adds nothing to your site, changes nothing about how Adobe runs, and needs no access to your Adobe accounts.
- Your data stays in your browser. What the inspector captures is kept in the browser’s session storage for that tab and cleared when you close it. Nothing about the sites you inspect is sent to MiaProva or Adswerve.
- It stays light. Recent pages keep full payloads; older pages in a tab keep a compact version with every detail the findings need. Memory stays flat over a long day of browsing, even on Adobe-heavy sites.
- You stay in control. Turn MiaProva off entirely, or disable it on specific domains, from the extension’s options.
- Sign-in is only for MiaProva customer features. Results, ideas and screenshots connect to your organization’s MiaProva account. The AEP Inspector works without signing in.
Getting started
- Install or update the extension from the Chrome Web Store.
- Open any page that runs Adobe and click the MiaProva launcher on the right edge of the page.
- Choose AEP to open the inspector. For more room, click Side panel, or press Alt+Shift+M.
- No Adobe site handy? Choose Load demo capture from the inspector’s menu to explore every view with sample data.
- MiaProva customers can sign in for live results, ideas and screenshots in context.
One view of your program, from the page up
The MiaProva application and the extension are growing into AEP together, and they complement each other. The application watches your optimization and AEP program over time and across teams. The extension shows you one page in detail, right where the issue happens.
If the inspector surfaces something you’d like help with, the extension’s Contact us page summarizes what it noticed on the page and gives you a direct line to the Adswerve team. We’d also love to hear what you’d like the inspector to check next: write to us at support@miaprova.com, or learn more at miaprova.com.