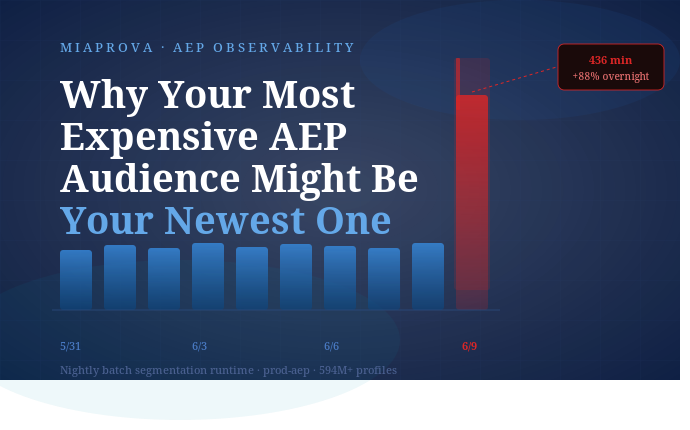
Beyond Batch Windows: Scoring the True Complexity of AEP Audiences
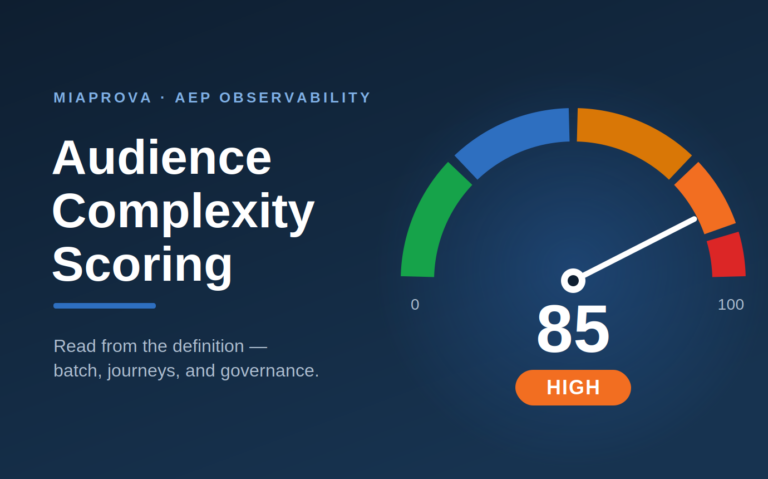
Introducing Audience Complexity Scoring in MiaProva: a 0–100 cost and risk score read directly from the audience definition. It started as a way to protect the nightly batch job. It turned into a much bigger signal — because the same characteristics that make an Adobe Experience Platform audience expensive to evaluate (long lookbacks, aggregations, joins,…