Introducing MiaProva Batch Volume: See What’s Really Flowing Into AEP
Your dataflows are green. Is your data actually healthy?
Adobe Experience Platform can tell you whether an individual dataflow succeeded. It is much harder to answer the more important question: is everything flowing into AEP behaving normally?
How much data arrived yesterday, and which feeds drove it? Did anything run late, twice, empty or much larger than usual? Did streaming slow down across the whole environment? Did a successful load actually write the records you expected? Every audience, journey and dashboard in AEP depends on the answers.
AEP gives detailed operational information about individual flows, but teams rarely have a single view across scheduled ingestion, streaming datastreams, manual uploads and audience connections. Problems hide in that gap. A feed quietly stops refreshing. A test audience pushes more than a billion rows into production. A predictable batch suddenly doubles in size. Streaming events are held for hours and replayed later.
The runs may still show as successful.
Today we’re introducing Batch Volume in MiaProva, a new service that makes those patterns visible. It’s also a growing part of how Adswerve delivers AEP consulting and managed services.
What Batch Volume is
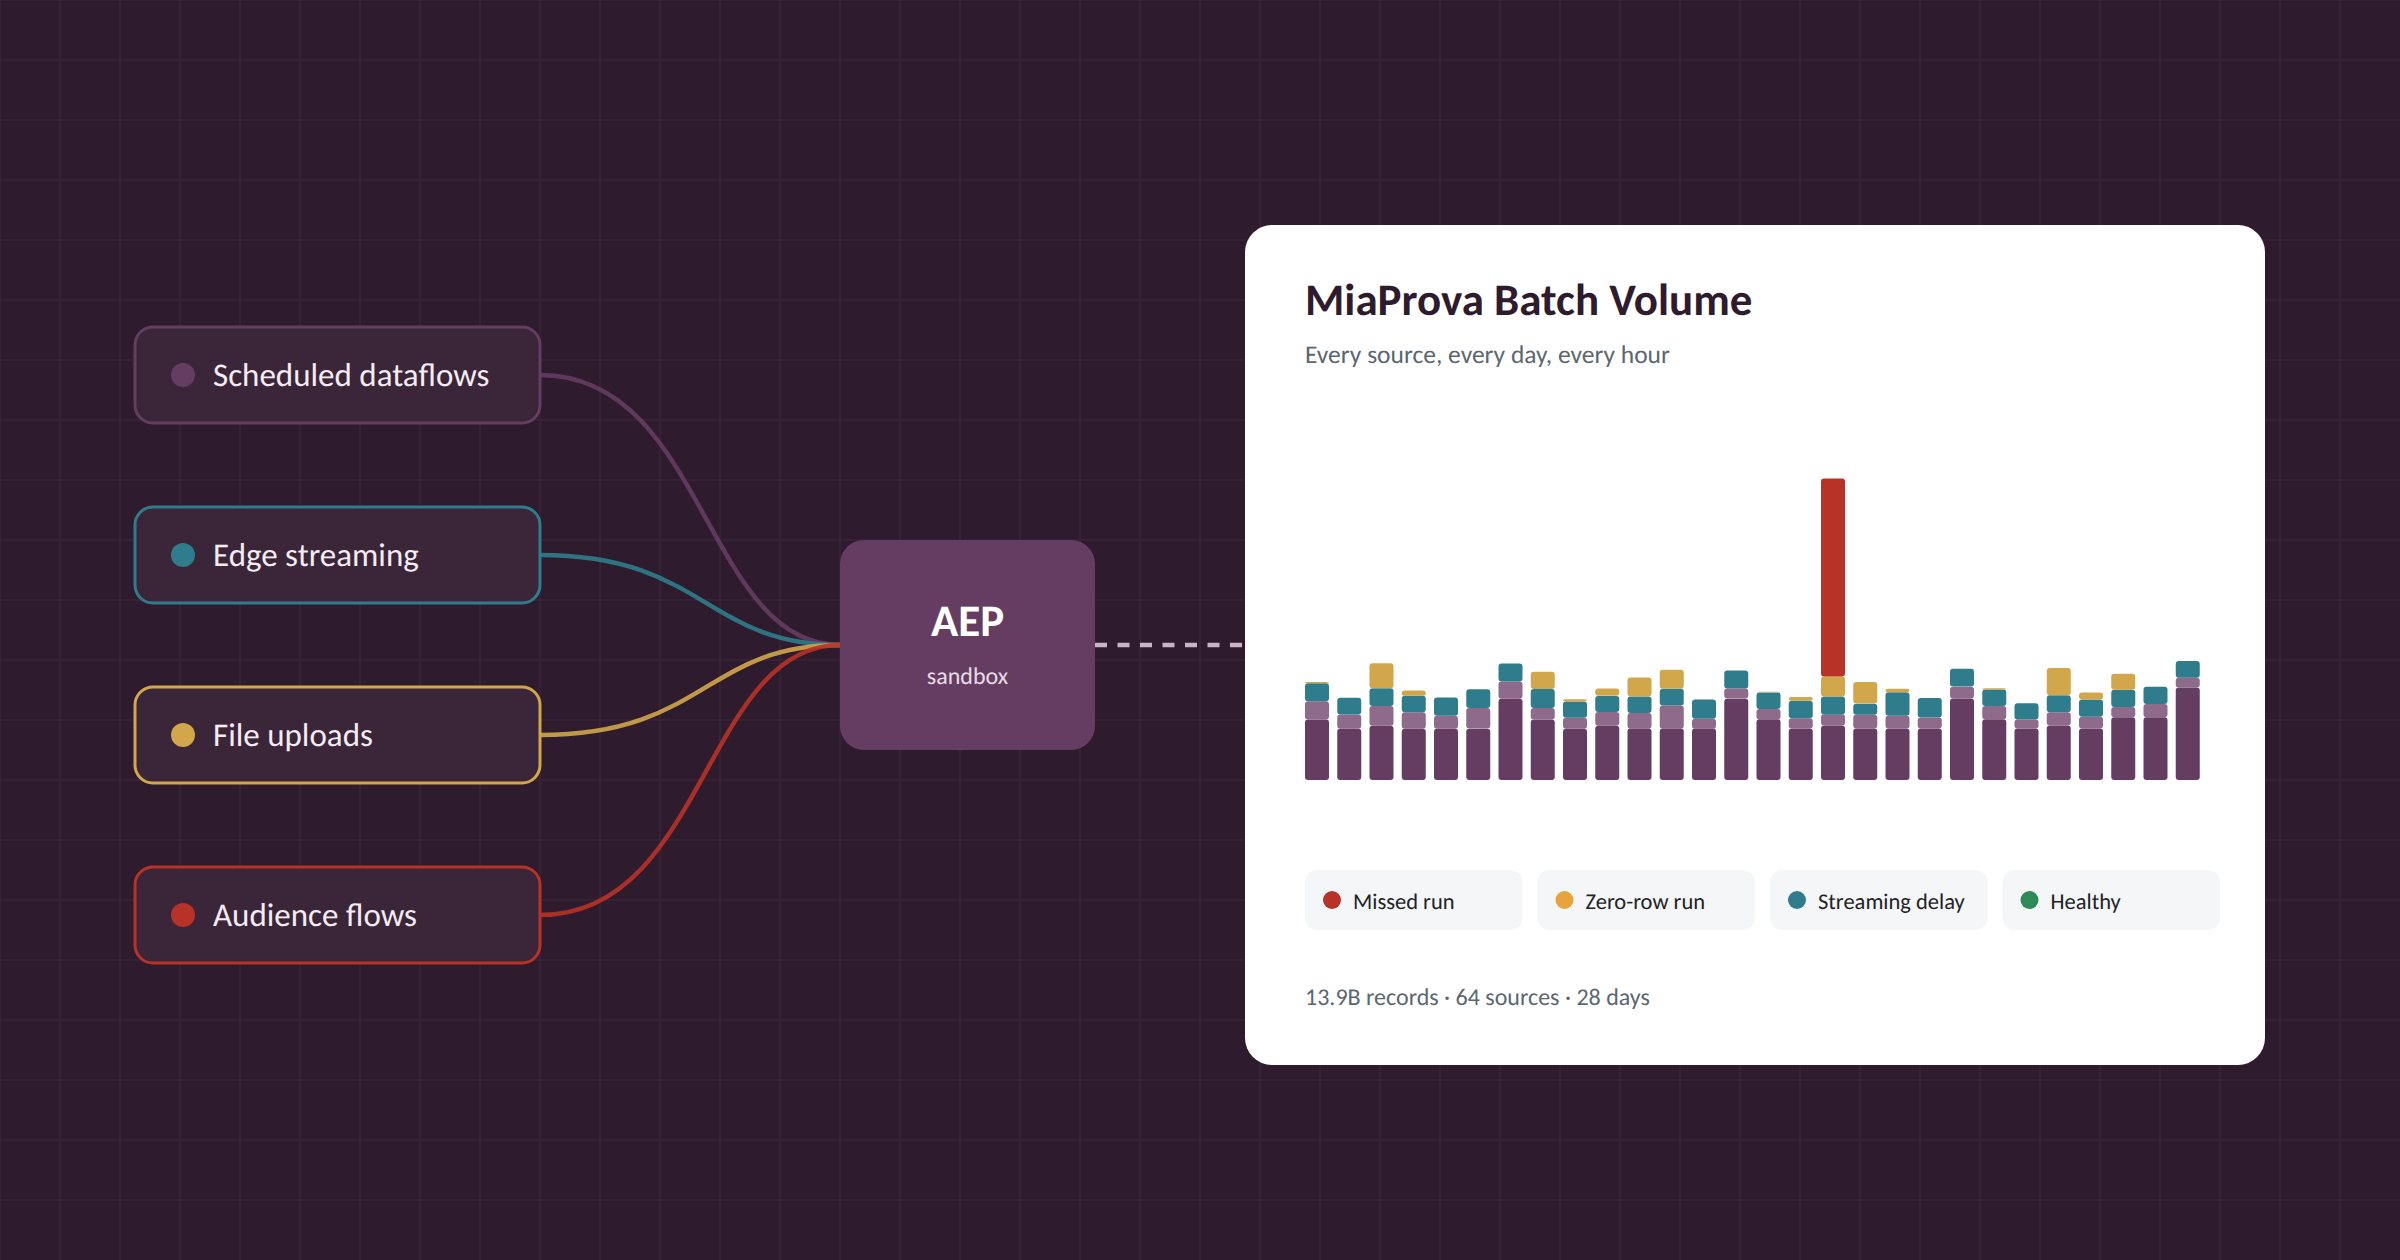
Batch Volume brings AEP ingestion activity into one place and tracks it daily and hour by hour. It covers the major ingestion paths:
- Scheduled dataflows from cloud storage, databases and connectors
- Streaming through Edge Network datastreams for web and mobile
- Manual file uploads
- Audience and profile flow connections, including Federated Audience Composition
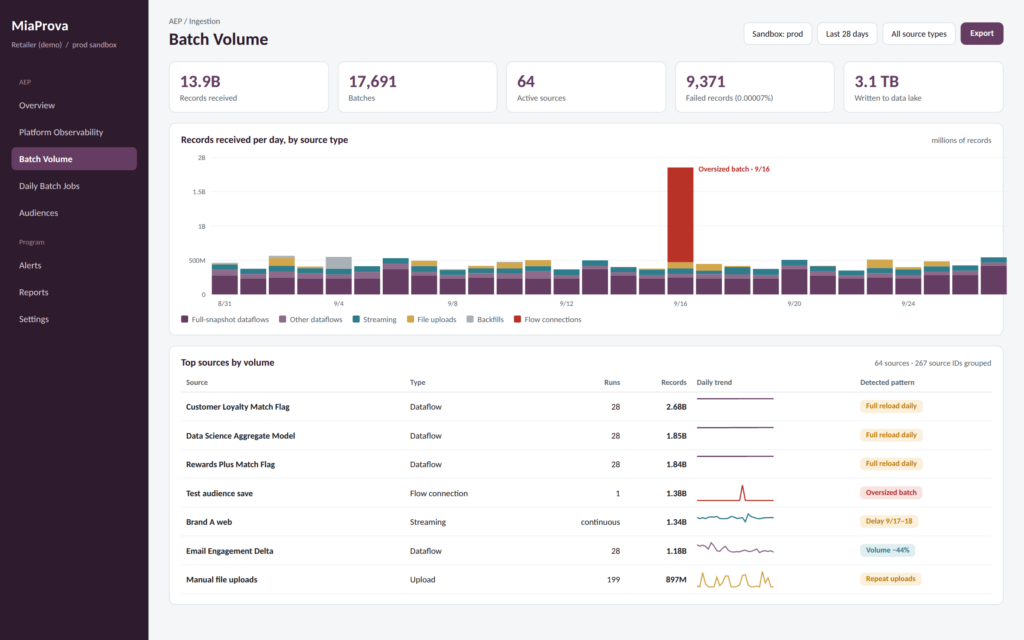
For each source, MiaProva captures batches, records received, records written, failed and skipped records, and bytes in and out. It keeps that history, which is what makes it possible to see how each feed normally behaves.
A nightly customer feed may typically land in the 2:00 AM hour with roughly 18 million records. A web datastream may follow a completely different hourly pattern on weekdays than on weekends. A customer table may change by only a few thousand records even though hundreds of millions of rows are reloaded. Those patterns become the baseline, so you can tell something that is merely large from something that is unusual for that specific feed.
How it works
Batch Volume reads AEP flow-run metrics through Adobe’s APIs, so there is nothing new to install in your sandbox or data pipelines.
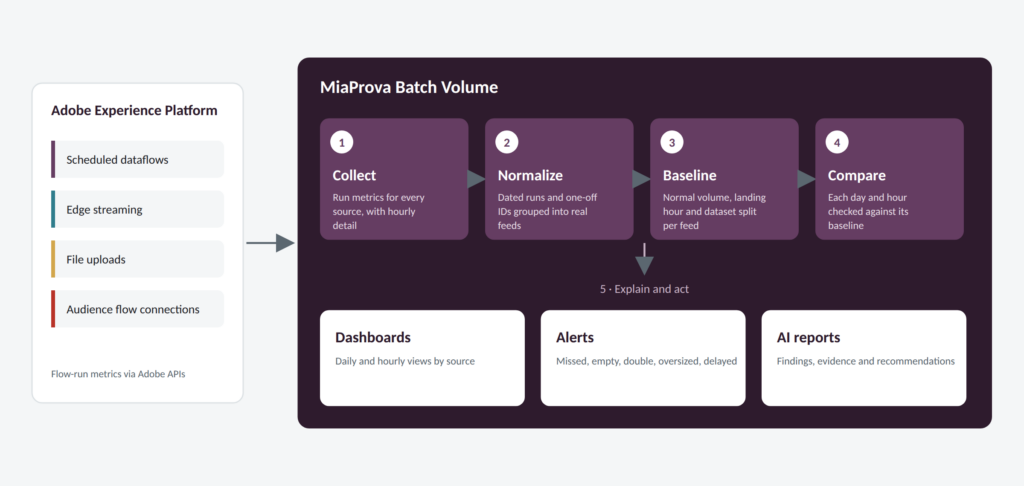
- Collect. MiaProva gathers run metrics across scheduled ingestion, streaming, uploads and supported flow connections, with hourly detail per source.
- Normalize. AEP often spreads related activity across many source IDs or dated run names. MiaProva groups them into the logical feeds teams actually recognize; in one review, 267 raw source IDs collapsed into 64 feeds.
- Baseline. Each feed gets its own normal for volume, landing hour, row counts, hourly streaming behavior and dataset distribution.
- Compare. Activity is compared with those baselines, so missed runs, empty loads, duplicate activity, oversized batches and streaming gaps stand out.
- Explain. The same structured data feeds MiaProva’s AI analysis, which summarizes findings, supporting evidence and where to investigate.
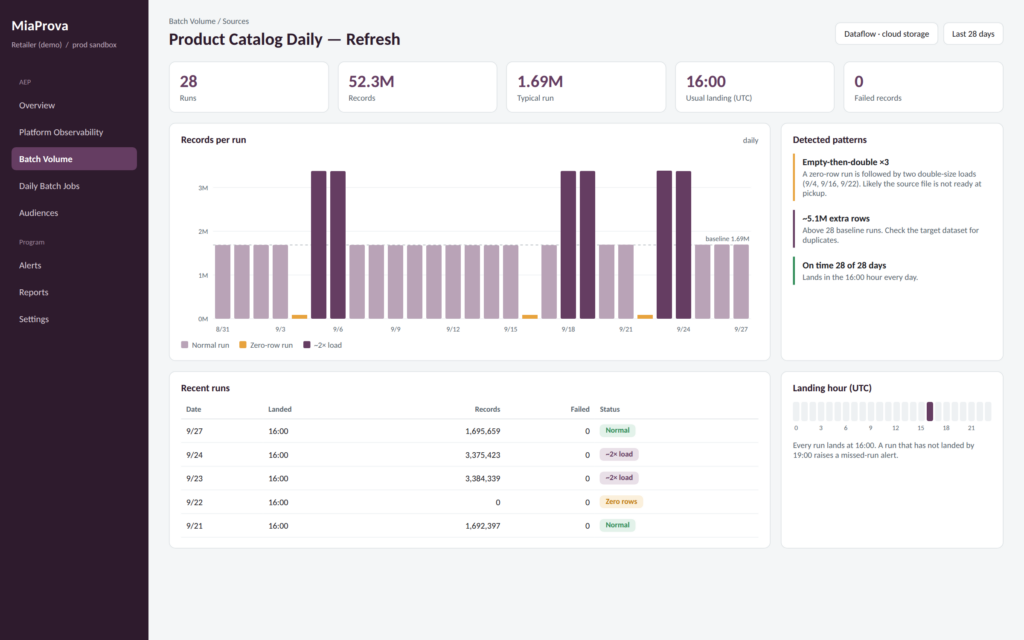
What it finds: 28 days at a large retailer
We recently ran Batch Volume across 28 days of production AEP ingestion for a large multi-brand retailer, anonymized for the examples below. At first glance things looked healthy. Record-level failures were fewer than one per million records processed. But when we stopped looking only for failures and started looking for abnormal behavior, a very different picture emerged.
| What we found | Scale | Why it matters |
|---|---|---|
| Full-snapshot feeds reloading the entire population every day | 54% of all rows, ~284M/day, while underlying counts moved by thousands | Significant profile writes, storage and downstream processing for data that barely changed |
| Weekly feeds repeatedly loading identical row counts | Same row count, to the record, four weeks running | Could indicate an upstream process that stopped refreshing |
| A test audience saved into production | 1.38B rows in one batch, 3.2× a normal day | Governance issue and potentially significant additional downstream processing |
| A streaming delay across every datastream at once | ~12 hours of events held back and later replayed | Real-time audiences and triggered journeys may have been operating on delayed data |
| Empty-then-double runs | Zero-row run followed by two unusually large days, three times on one feed | Strong signal an upstream file wasn’t ready when ingestion ran |
| A mobile dataset skipping 100% of events | 171M events received, none written | Likely mapping, schema or routing issue worth immediate investigation |
| Manual uploads repeated the same day | ~17% of uploaded rows matched another same-day upload exactly | Potential retries or duplicate ingestion |
Almost none of these were failed dataflows. The runs were green. The data was not necessarily healthy.
That distinction is why we built Batch Volume. Operational success tells you whether the pipeline executed. Behavioral baselines tell you whether what happened was actually normal.
From telemetry to an actionable AEP review, with AI
Ingestion telemetry gets large quickly: that 28-day analysis covered 1,391 source-days, each with hourly activity and multiple metrics. MiaProva uses AI to turn that structured information into something an AEP team can investigate quickly.
It looks for the same patterns our AEP teams do, including feed behavior over time, unusual record or byte volume, changes in landing times, missing or empty runs, cross-source streaming anomalies, dataset-routing changes, repeated uploads and large deviations from a feed’s normal behavior.
It then summarizes the findings with supporting evidence and suggests where to investigate next. The goal is not to replace the consultant or data engineer; it’s to give them a much better starting point. Instead of spending the start of an engagement assembling run histories, the team begins with prioritized evidence and spends its time understanding why something happened and what should change.
The two decks behind the examples below, one on batch ingestion and one on web streaming, were generated from MiaProva exports this way.
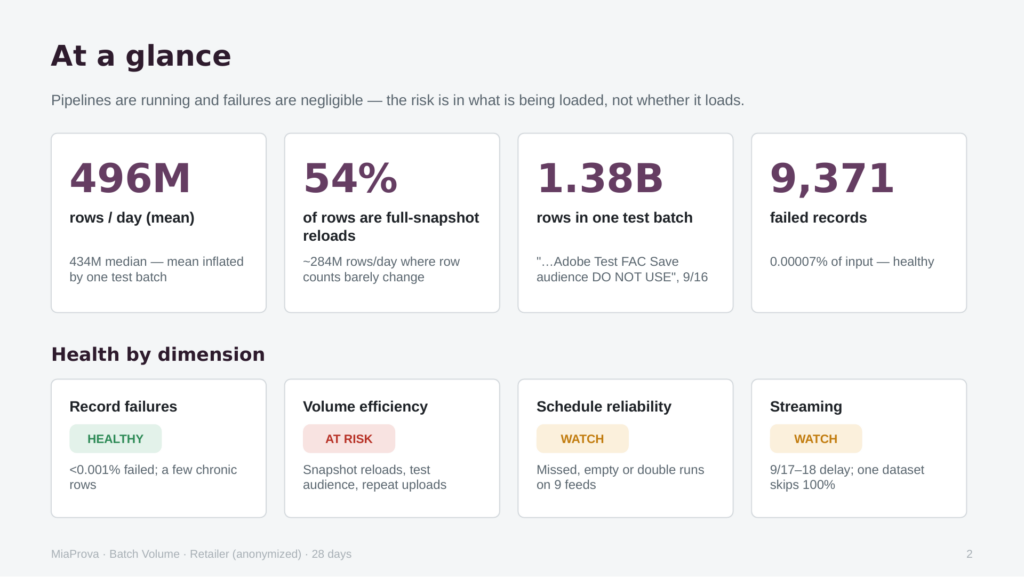
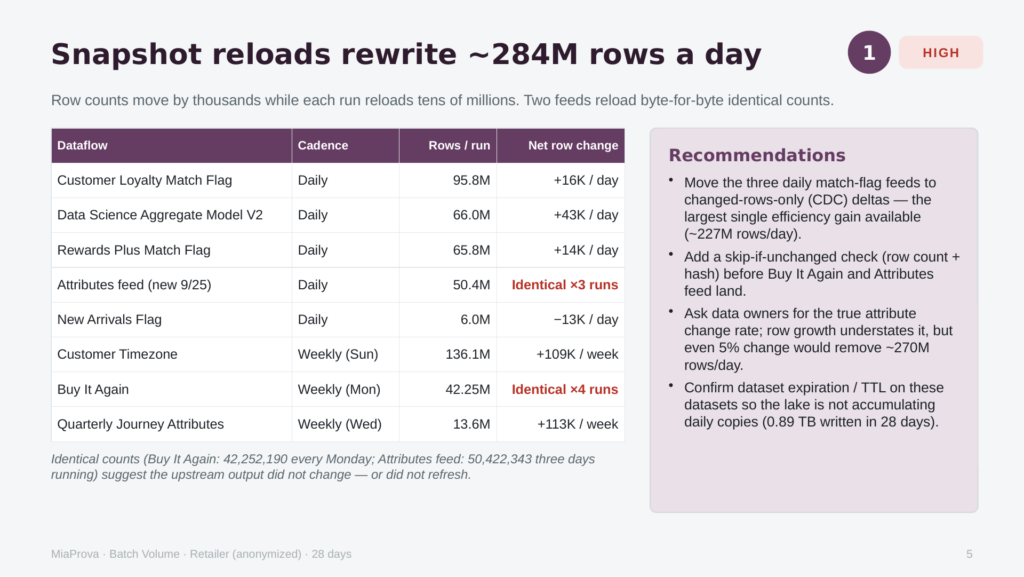
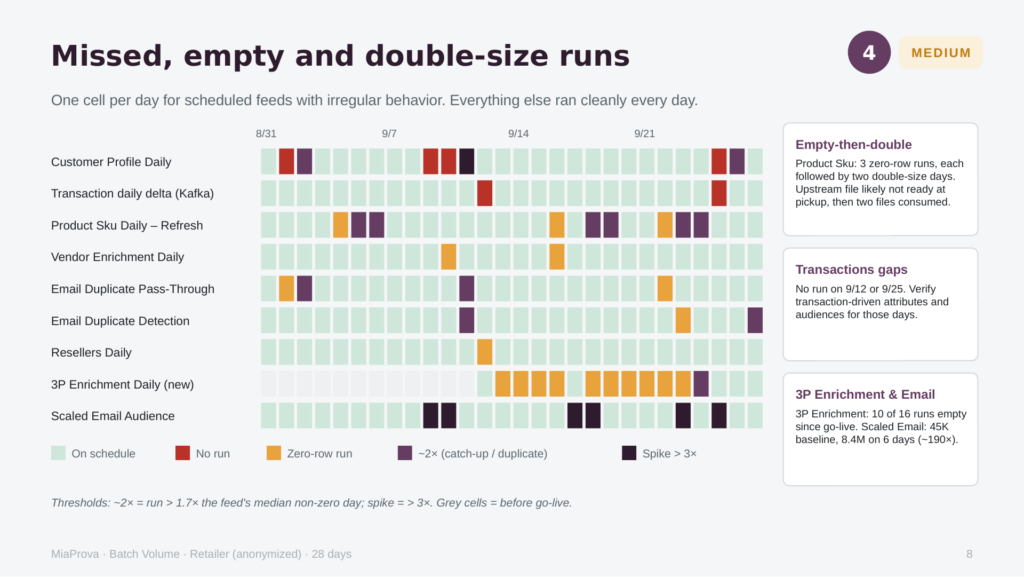
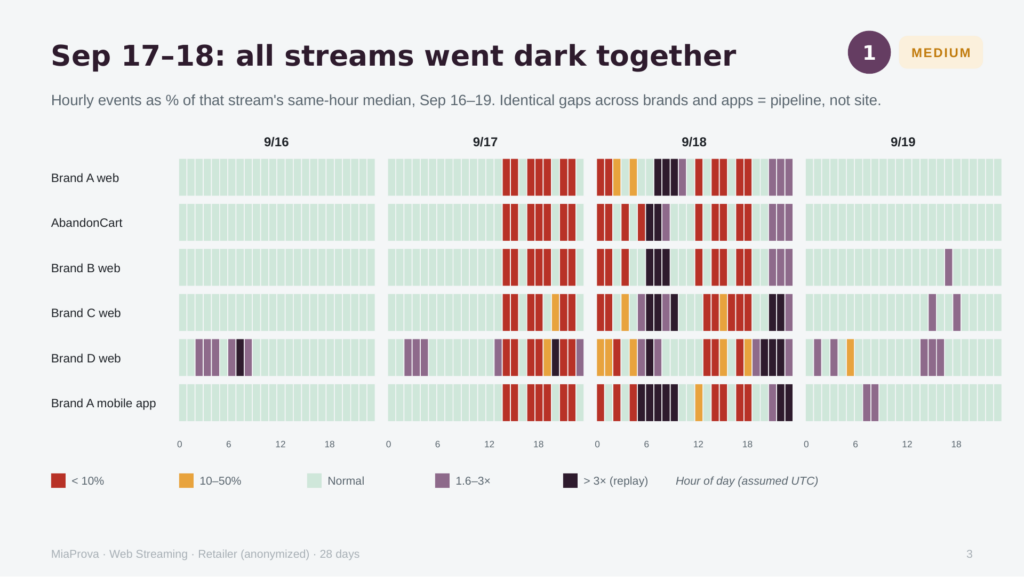
The analysis also makes uncertainty explicit. If the metrics can’t settle something on their own, such as whether an unusual streaming pattern reflects delayed processing or records attributed to another flow, the report says so and names the query or evidence needed to answer it.
The value it delivers
| For | What Batch Volume changes |
|---|---|
| AEP platform teams | Catch missed, empty, duplicate and oversized loads before they become downstream problems |
| Marketing and journey teams | Know whether audiences and triggers are running on fresh, complete data |
| Data engineering teams | Find unnecessary full reloads, stale feeds and inefficient ingestion. In the retailer example, three feeds alone accounted for ~227M avoidable rows a day |
| Leadership | See the health, volume and governance of AEP ingestion in one place |
Part of how Adswerve runs AEP
Batch Volume is one part of MiaProva’s broader investment in the AEP lifecycle, alongside platform observability, batch segmentation monitoring, audience health and governance capabilities.
For Adswerve clients on AEP consulting and managed services, it changes how the conversation starts. Instead of a set of disconnected operational screens, our teams begin a weekly or monthly review with a shared view of what has actually been happening: what changed, what looks unusual, what is generating unnecessary volume, what could affect audiences, segmentation, journeys or reporting, and what deserves attention first.
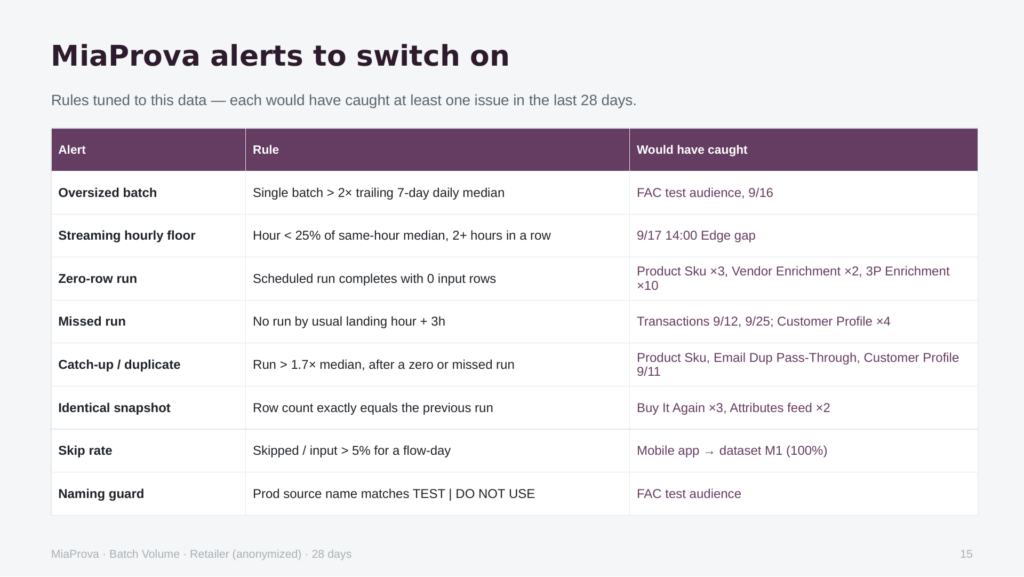
MiaProva surfaces the evidence. Our AEP teams help customers understand the cause, judge the impact and turn findings into fixes, governance improvements and alert rules tuned to their own data.
What’s next
We’re bringing more of this analysis directly into MiaProva with a Generate Insights capability on Batch Volume and other key AEP pages, plus a contextual chat experience for asking questions directly of the data.
That could mean asking questions such as:
- Which feeds ran late this week?
- What changed on Tuesday?
- Which sources are sending significantly more data than normal?
- Did any feeds stop refreshing?
The idea is simple: make the operational data already available in AEP much easier to interrogate, understand and act on.
What is flowing into your AEP sandbox?
When we run Batch Volume across an AEP environment, we often find something worth investigating: a full reload nobody needs, a feed that stopped changing, an unusual spike in volume, or a dataflow that technically succeeded but behaved nothing like normal. That is the value of looking beyond whether a job simply turned green.
If you’re an Adswerve client, you’ll increasingly see these capabilities become part of how we support AEP engagements. And if you’d like to see what Batch Volume uncovers in your own environment, reach out to your Adswerve team or contact us through MiaProva.