Six new features in the MiaProva Chrome Extension
One of our longtime Adobe Target practitioners and MiaProva users recently reached out with some great suggestions. They’re currently deep into migrating Adobe Analytics and Adobe Target to Web SDK as part of their organization’s larger initiative to leverage RT-CDP for Target personalization, with Adobe Journey Optimizer (AJO) coming next.
Below are the details of each new feature that Chrome published last night.
Filter by datastream
A picker sits under the page scope whenever a capture holds more than one datastream, and choosing one hides the Edge calls belonging to the others.
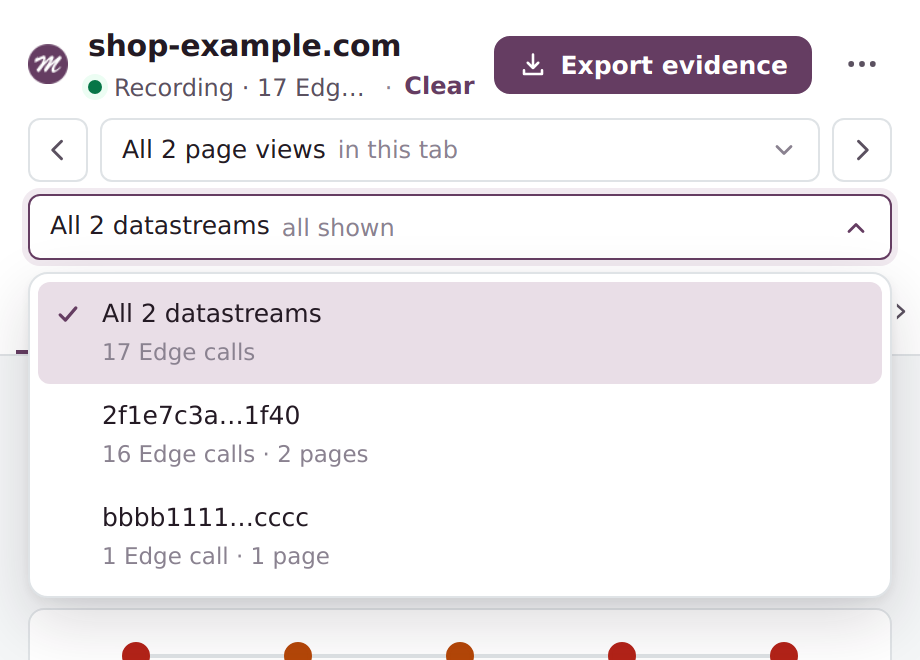
This customer site runs a second datastream alongside the production one. Every view — Timeline, Personalization, Data quality — mixed both, and the inspector was reporting on an implementation they weren’t debugging.
Three details worth knowing:
- Calls with no datastream of their own always stay. at.js, AppMeasurement, the Tags library and demdex have no
configId, and filtering them out would silence the very checks that compare them against Web SDK, like double-counting into a report suite. - The findings that compare datastreams keep firing. “More than one datastream on a page” and “Same datastream used on production and non-production hosts” deliberately read past the filter, and each says so under its detail. Hiding the finding that explains why you needed the filter would be the wrong kind of clever.
- The choice is remembered per host. It describes the site rather than a moment in it, so it survives navigation — and it’s dropped as soon as that datastream stops appearing, so a filter set on one client’s site never follows you to the next.
The picker also reports how many calls it’s hiding, so a quiet view is never quiet by accident.
Step through page views
Arrows either side of the page picker move you one page view at a time, and the left and right arrow keys do the same.
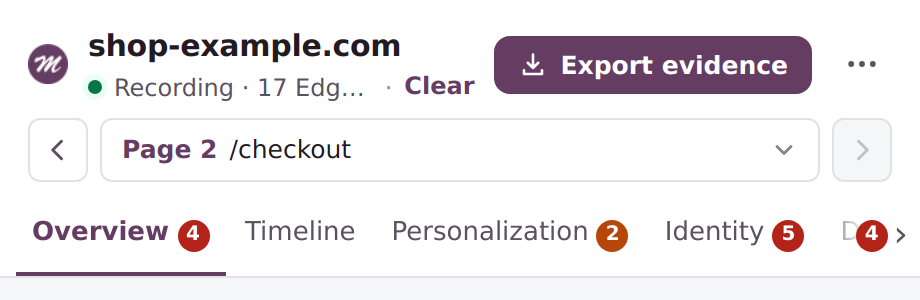
The request came from Data quality, where findings are reported per page and the old way to move between them was opening a dropdown and picking from a list. On a long session that’s a lot of clicking.
The arrows move the scope itself rather than keeping a cursor of their own, so stepping to page 3 on Data quality leaves you on page 3 on Timeline and Personalization too. From “all pages” they enter the list at the first or last page, and they stop at the ends instead of wrapping around.
The keys stay out of the way when something else owns them: an open picker, the full-screen request view, or a text field.
The Timeline legend is now the filter
The coloured key under the Timeline was already telling you what each kind of call was. Now you can click it.
Each entry is a chip carrying its count — Consent, Identity, Decisions, Display notification, Data collection, Legacy tag, Library. Click one to see only that kind, click more to add them, click a chosen one to drop it. Nothing chosen still means everything, exactly as before.
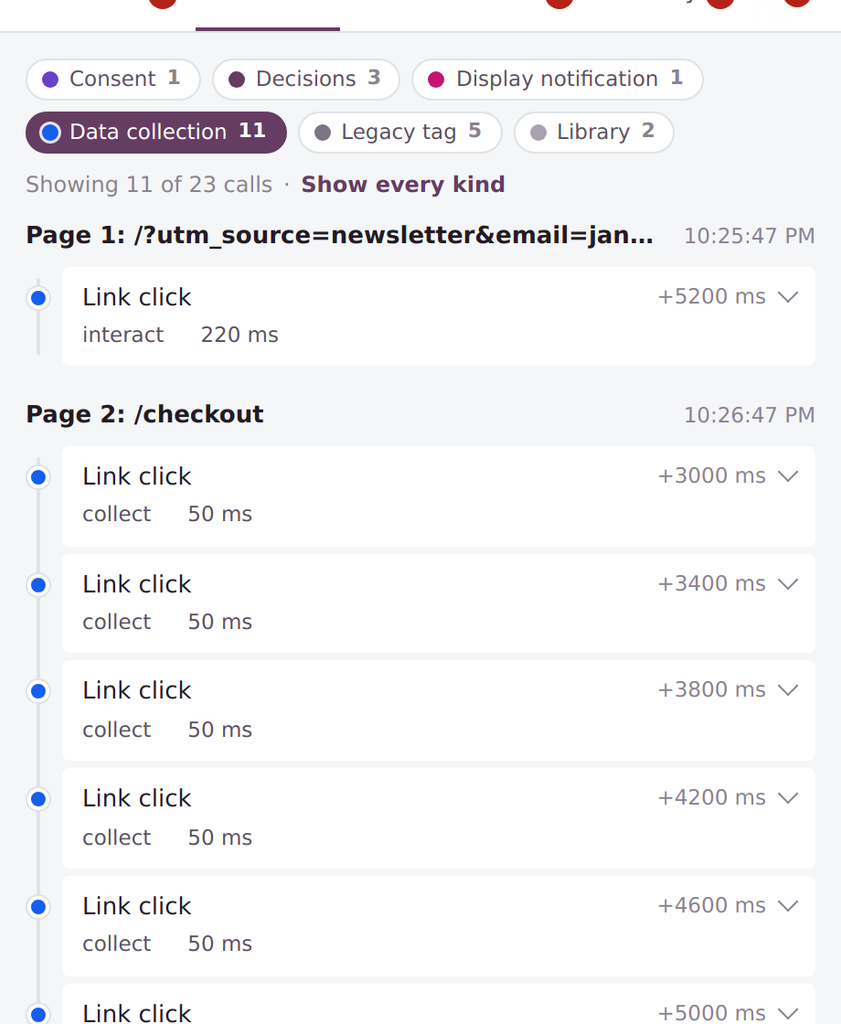
Kinds that nothing in the capture uses are left out of the row, so the chips describe your capture rather than a fixed list, and the counts follow the page and datastream scopes above them. A page with nothing of the chosen kind says so rather than appearing empty, and entries still expand in place while a filter is on.
It’s a small change that makes a particular job much faster: “show me only the consent calls, in order, across this session” used to mean reading past everything else.
Filter the decisions on Personalization
Personalization now has chips for source (Target, Journey Optimizer) and displayed state, plus a picker for the activity, with a “Showing 3 of 14 decisions” line and a way to clear them.
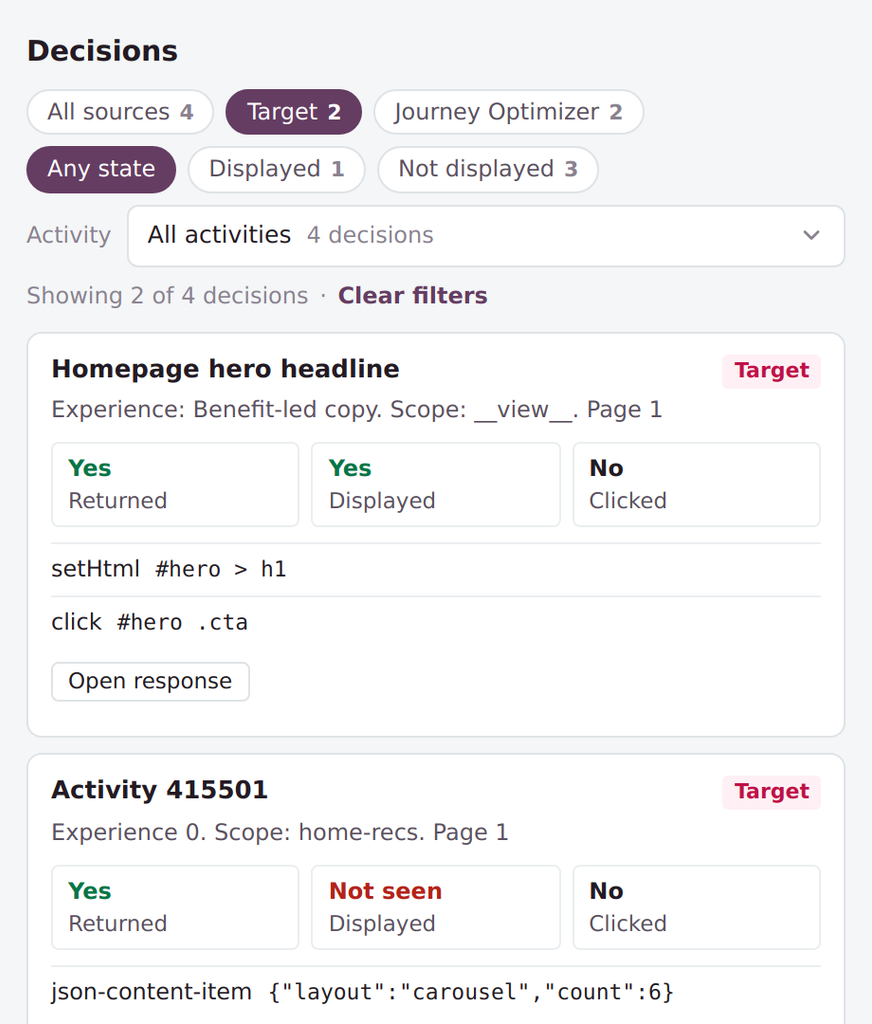
On a page running a dozen activities, finding the one you’re debugging meant scrolling through cards. Now you can narrow to one activity, or to everything Journey Optimizer returned, or to the decisions that came back but were never confirmed as displayed.
One deliberate limit: the filters narrow the Decisions list only. The findings above it and the at.js versus Web SDK comparison below it still describe the whole capture. Quietly narrowing those would mean a filtered view reporting fewer problems than the page actually has, which is the sort of thing you only discover after you’ve sent the report.
Export what Adobe Target is running on a page
The biggest addition. One artifact that answers the question everyone asks when they land on a client’s page: what tests are running here, and which experiences am I seeing?
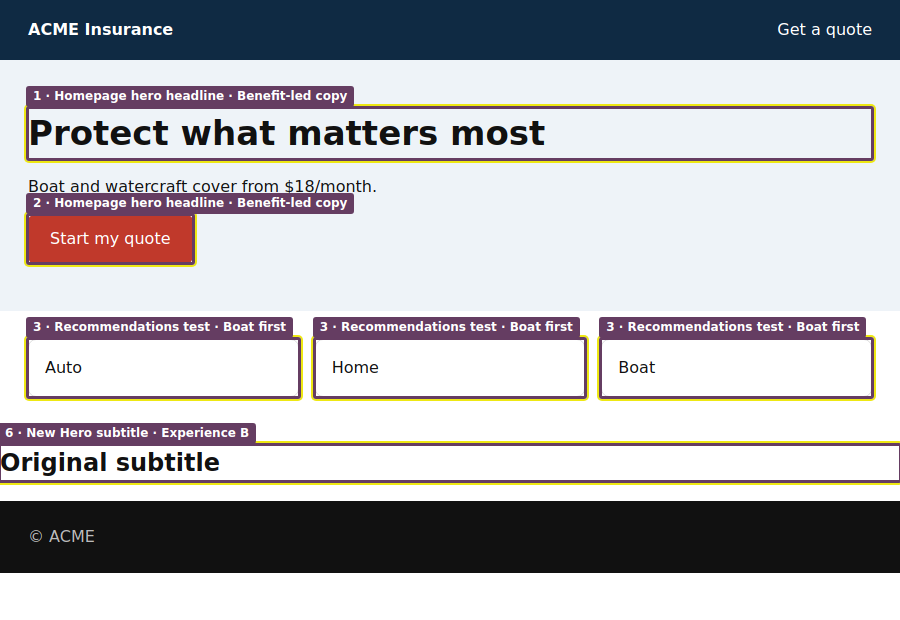
The export opens from three places — a button above the Activities list, a card on Personalization, and the inspector itself — and contains:
- A screenshot of the page with every changed element outlined, each one labelled with its activity and experience. Not a bare screenshot: the actual elements, marked.
- Every activity and experience delivered to the capture, with where it was delivered (mbox, scope or surface), whether it was confirmed as displayed, and its A4T token where there is one.
- The Target delivery calls behind them, request and response, with their response tokens intact.
It downloads as a standalone HTML report you can send to someone, or as JSON if you want the data. The same redaction switches as the AEP evidence pack apply to both, so personal data is masked and identifiers hashed by default — an export is the artifact most likely to get forwarded.
The annotation is drawn into a layer of its own and removed as soon as the capture is taken, including when the capture fails. It never touches the page’s own nodes, so nothing the site does is disturbed.
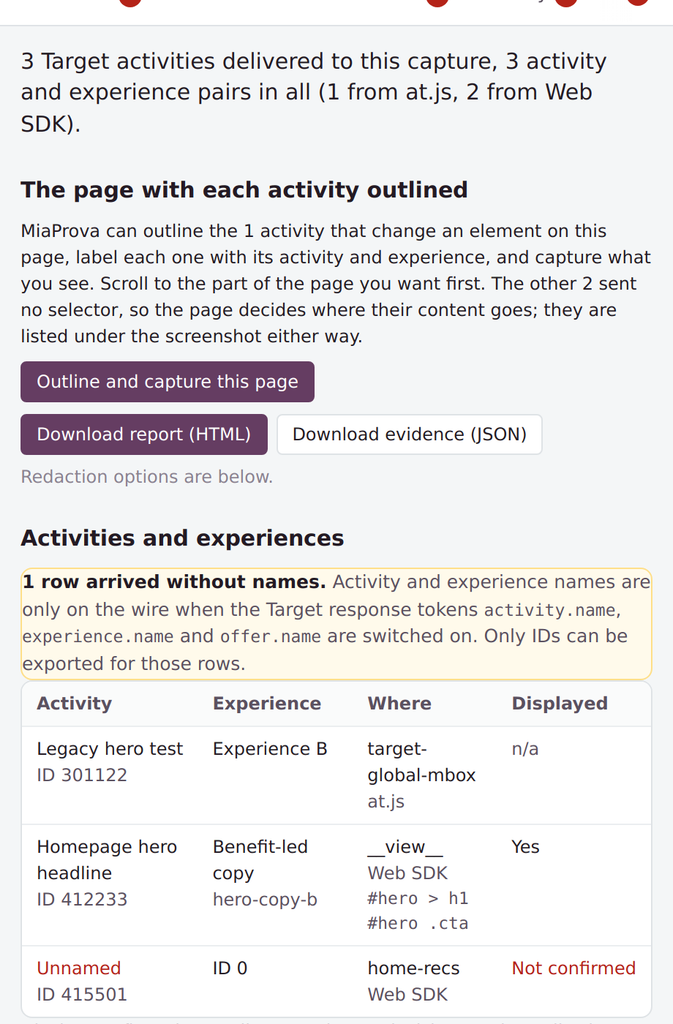
When an activity can’t be outlined, the export says why
Not every Target activity changes something you can see, and an export that listed only the ones it could outline looked like it was losing activities.
A real large retailer’s homepage made the point: six activities delivered, but only three appeared under the screenshot. The three missing ones were a redirect offer and two offers delivered to named mboxes — hero-mbox-1 and spotlight-mbox-3 — where the page decides where the content goes and nothing on the wire says where it lands. The three that did appear all targeted <head> with setHtml: code injections with no element to outline, reported as though they were simply missing.
Every activity now gets a row under the screenshot, and each says what became of it:
| What the export says | What it means |
|---|---|
| Outlined in the image | The element was found and marked |
| Injects code | The target is <head>, <script>, <style> or similar — nothing visible to outline |
| Delivered to a named location with no selector | An mbox or scope offer the page places itself |
| On the page but with no size | Present but hidden or collapsed when the shot was taken |
| Not found on this page view | Further down the page, on another page of the capture, or replaced since |
The caption counts activities rather than elements, so you get “1 of 6 activities outlined, 3 inject code, 2 are rendered by the page” instead of a bare zero. An empty-looking screenshot now comes with an answer attached.
Where this fits
The extension has always been free, and it stays free. It’s used across the Adobe Target community, and these updates come straight from what that community asked for.
If you’re already running the extension, it updates itself through the Chrome Web Store. If you’re not, it’s there under MiaProva — and if you want to talk through anything it turns up on your own site, Contact us is built into the overlay.
And if you have any ideas on features that would help you or your organization, please reach out as we would be happy to see what we can do.