Why Your Most Expensive AEP Audience Might Be Your Newest One
A real-world investigation into AEP batch segmentation performance, segment complexity, and the observability gap in between.
Recently a client’s nightly batch job took 7.3 hours instead of 3.5. Profile count was actually down slightly from the night before. Here’s what we found.
Many enterprise RT-CDP deployments that rely on scheduled audience activation depend on a daily batch segmentation job. It evaluates hundreds of audience definitions against hundreds of millions of profiles and feeds the results downstream to email platforms, SMS providers, direct mail vendors, paid media destinations, and more. When that job runs in 3.5 hours, nobody notices. When it takes 7.3 hours, the entire activation pipeline shifts, time-sensitive channel SLAs get threatened, and the question “what happened?” has no obvious answer.
That’s exactly the situation one of our clients found themselves in recently. They’re a large multi-brand retailer running AEP in production with over 594 million profiles. This is the story of how MiaProva’s Daily Batch Job Monitor surfaced the problem, how we investigated it, what we found, and what it reveals about a broader challenge in AEP’s native observability that every RT-CDP practitioner should understand.
The Baseline: What “Normal” Looks Like
To understand why that morning’s batch job was alarming, you need context on what normal looks like for this client.
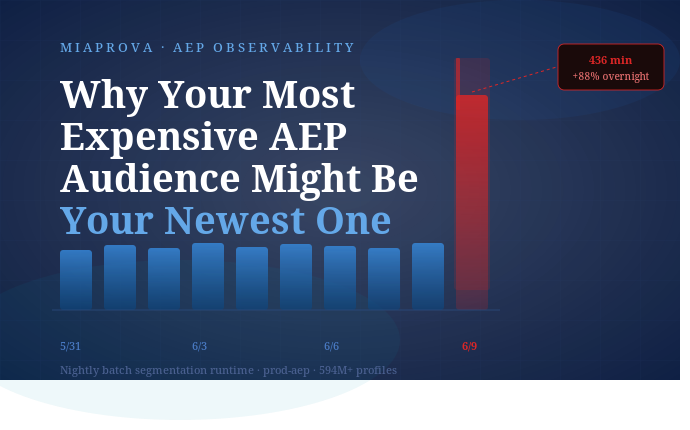
Over the preceding 10 days, the nightly batch segmentation job had completed in a range of 211 to 232 minutes, roughly 3.5 to 4 hours. Profile count had been growing gradually, from about 593.4M to 595.1M, and runtime had grown proportionally. It was a stable, healthy pipeline.
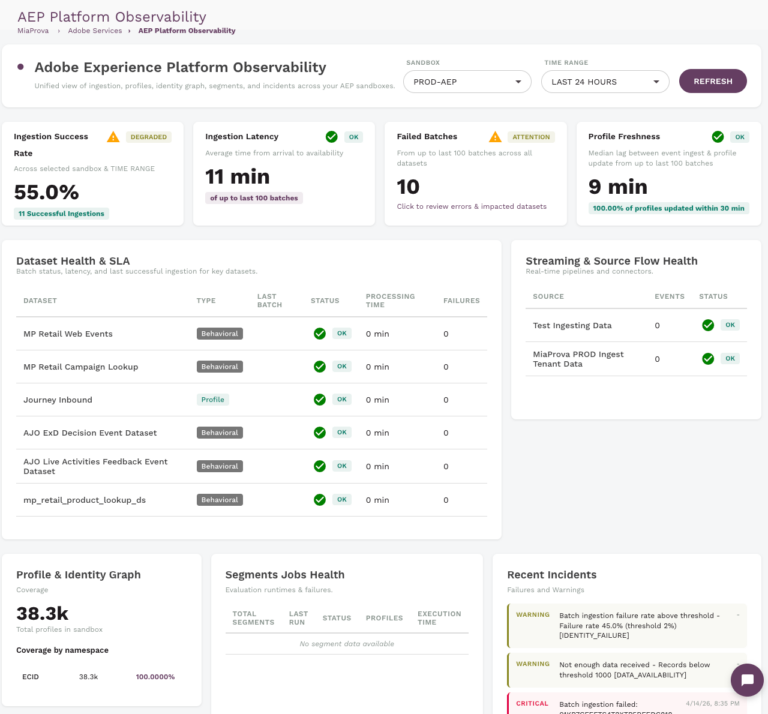
MiaProva’s Daily Batch Job Monitor tracks this daily. It pulls job completion time, total profiles evaluated, and runtime from the AEP Segmentation Jobs API and presents it alongside destination activation status, the Seg to Activation Gap metric, and skip rate health across all flow runs. Every morning, the client’s operations team sees a single consolidated view of whether the previous night’s pipeline ran cleanly.
Here’s what the 10-day runtime history looked like going into the day in question:
| Date | Duration | Profiles | Status |
|---|---|---|---|
| 5/31 | 213 min | 593.4M | ✓ Succeeded |
| 6/1 | 213 min | 593.5M | ✓ Succeeded |
| 6/2 | 213 min | 594.2M | ✓ Succeeded |
| 6/3 | 222 min | 594.5M | ✓ Succeeded |
| 6/4 | 224 min | 594.9M | ✓ Succeeded |
| 6/5 | 224 min | 595.2M | ✓ Succeeded |
| 6/6 | 214 min | 595.8M | ✓ Succeeded |
| 6/7 | 211 min | 595.7M | ✓ Succeeded |
| 6/8 | 232 min | 595.1M | ✓ Succeeded |
| 6/9 | 436 min | 594.9M | ⚠️ ATTENTION |
The number that jumped off the page: 436 minutes. Nearly 7.3 hours. And profile count was actually down slightly from the previous day, so this wasn’t a data volume story.
10-Day Segmentation Runtime
prod-aep · nightly batch · 594M+ profiles
436 min
6/9 · +88% vs prior day
211–232
Normal range (min)
594.9M
Profiles on 6/9 (↓ vs prior day)
+204 min
Above prior day
80.5 min
Seg → Activation gap
What the Monitor Showed
MiaProva’s Daily Batch Job Monitor flagged this immediately across four KPI cards at the top of the dashboard.
The Segmentation Job card, normally green, showed 436.1 min / ATTENTION. The Seg to Activation Gap card showed 80.5 minutes, well above the 30-minute MiaProva threshold. Both were downstream of the same underlying issue: the batch job had taken so long that by the time it finished at 07:46 UTC, the pre-processing flows were already running, and the first activation wave didn’t start until 09:07 UTC.
Critically, all 56 of 56 destination flow runs still completed. The pipeline finished, SLAs held, and channels activated. But the margin was gone. If the runtime crept any further, the activation window would start to break.
The question the monitor immediately raised but couldn’t answer on its own: why did it nearly double overnight?
The Investigation: What the APIs Could and Couldn’t Tell Us
The natural first instinct was to pull the segment job logs and look for a cost breakdown, specifically whether the spike was infrastructure-side (Adobe platform latency) or definition-side (an expensive audience that had been recently published).
We went to the AEP Segmentation Jobs API endpoint hoping to find an I/O vs. compute split in the metrics object. This is where the first challenge in AEP’s native observability surfaces. AEP does not expose I/O time vs. compute time on this endpoint. The API exposes useful aggregate timing and count fields, including total job time, profile segmentation time, total profiles, and per-segment realized/exited counts. What it does not expose is the internal I/O-versus-compute breakdown needed to distinguish platform latency from expensive audience logic with confidence.
Adobe’s status page at status.adobe.com showed no incidents for the relevant time window. That shifted the weight of evidence toward the definition side, but we still needed a specific culprit.
Checking for Recent Segment Changes
The Segmentation Definitions API includes an updateTime field on every segment definition. We pulled the full definition inventory sorted by most recently updated and filtered to definitions modified within 24 hours before the batch job’s start time. One audience surfaced immediately, created approximately 16 hours before the job ran.
That audience was a promotional targeting segment for a co-branded credit card program. We’ll call it Credit Segment 4.
The likely culprit: Four Compounding Cost Factors
The evidence strongly suggests the new audience was the likely driver of the runtime spike, but because AEP does not expose per-definition cost or I/O-versus-compute timing, the conclusion should be presented as a practitioner investigation rather than a formally proven platform root cause.
Credit Segment 4’s definition, when analyzed at the PQL level, contained four cost factors that each warranted attention on their own. Together, they explain how a single newly published audience could nearly double an enterprise batch job runtime.
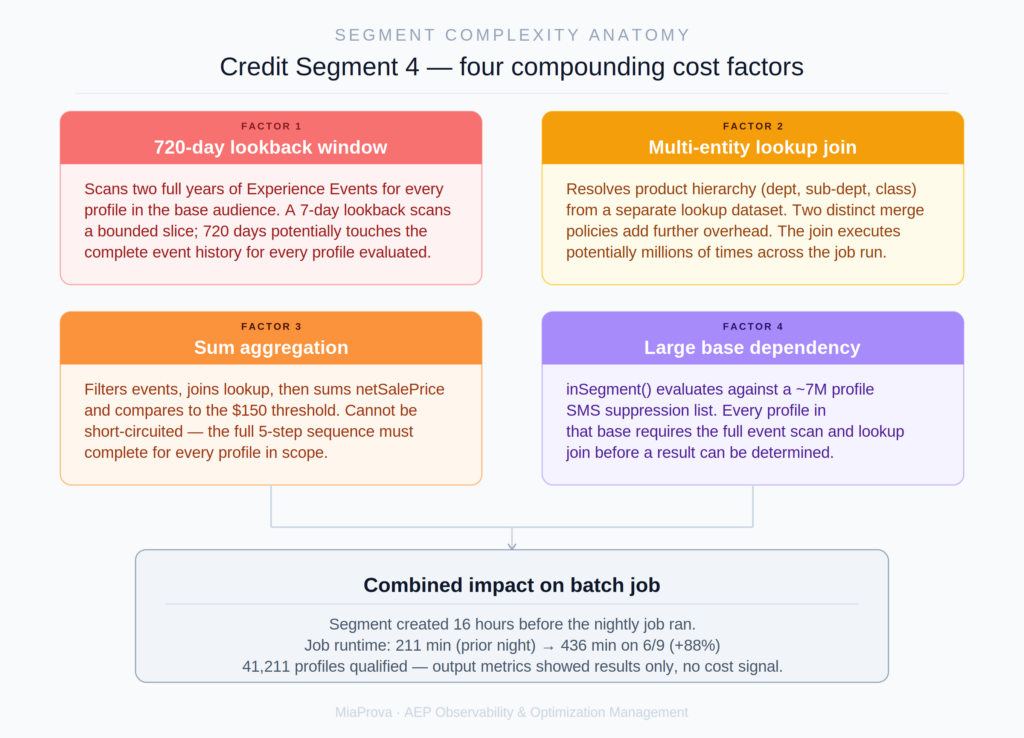
Factor 1: A 720-Day Lookback Window
The segment’s temporal constraint was in-last 720 days, covering two full years of purchase event history. AEP’s batch segmentation evaluates this by scanning the time-series Experience Event store for every qualifying profile in the base audience. A 7-day lookback scans a bounded slice of that event store. A 720-day lookback potentially touches the complete event history for every profile being evaluated.
At a base population in the millions, the volume of event records being scanned across a two-year window creates enormous pressure on the batch infrastructure, regardless of how many profiles ultimately qualify. This is the single highest-cost element in the definition. Assuming purchase events are reasonably distributed across the window, reducing this to 365 days could roughly halve the event volume considered; reducing it to 180 days could reduce it by roughly 75%.
Factor 2: A Multi-Entity Lookup Join
The segment’s product hierarchy criteria required filtering purchases to a specific department, sub-department, and class number. Resolving those attributes required joining to a custom lookup dataset via a multi-entity join. This is visible in the segment’s dataRefPaths:
_.classes.{lookupClassId}: [
    productDetails.classNumber,
    productDetails.departmentNumber,
    productDetails.subDepartmentNumber
]
Multi-entity joins in batch segmentation are significantly more expensive than profile-attribute-only evaluations. For every purchase event that passed the initial event type filter, AEP had to resolve the product attributes by joining to a separate lookup schema. Combined with the 720-day event scan, this join was being executed potentially millions of times across the job run.
The segment also referenced multiple merge-policy contexts. That is another useful complexity signal, even if the exact runtime impact is not exposed directly by the API. AEP must resolve identity stitching under different rules for different parts of the same segment definition, which adds further overhead.
Factor 3: A Sum Aggregation That Can’t Be Short-Circuited
The purchase condition wasn’t simply “has purchased from this department.” It was: filter all qualifying purchase events in the 720-day window, join to the lookup class to verify the product hierarchy, then sum net sale price across the filtered results, and only qualify the profile if that sum exceeds $150.
Unlike a simple “exists” condition, this kind of aggregation generally requires AEP to evaluate the qualifying event set before it can determine whether the profile meets the threshold. AEP must work through the full sequence for every profile in scope:
- Retrieve all purchase events in the 720-day window
- Join each to the lookup class for product attributes
- Filter that event set to the matching department, sub-department, and class
- Sum net sale price across all qualifying events
- Compare the result to the $150 threshold
For a frequent buyer with many purchase events across two years, this is a computationally intensive per-profile operation. There is no shortcut.
Factor 4: A Large Upstream Segment Dependency
Credit Segment 4 was defined as member of a base segment AND the purchase condition described above. The base segment was a suppressed SMS marketing list with a population of approximately 7 million profiles. Using a base segment as a pre-filter is good practice in principle because it reduces the population AEP needs to run the expensive event logic against. But 7 million profiles is still a large base, and every one of them required the full 720-day event scan and lookup join before the result could be determined.
A Detail Worth Noting
The segment definition JSON included a field called overridePerformanceWarnings, set to false. This field is set to true in AEP when a user explicitly dismisses a performance warning in the Segment Builder UI and publishes anyway. A value of false means the definition was not saved with performance warnings overridden. That suggests either no relevant performance warning was presented, or at least that the published definition did not require/record an explicit override. In either case, this is a useful signal for monitoring. A segment with a 720-day lookback, a multi-entity join, a sum aggregation, and a 7 million profile base is objectively expensive, and yet it passed through the builder without a flag. That’s not a criticism of the person who built it. It’s a signal about where native tooling has room to grow.
What the Metrics Object Doesn’t Tell You
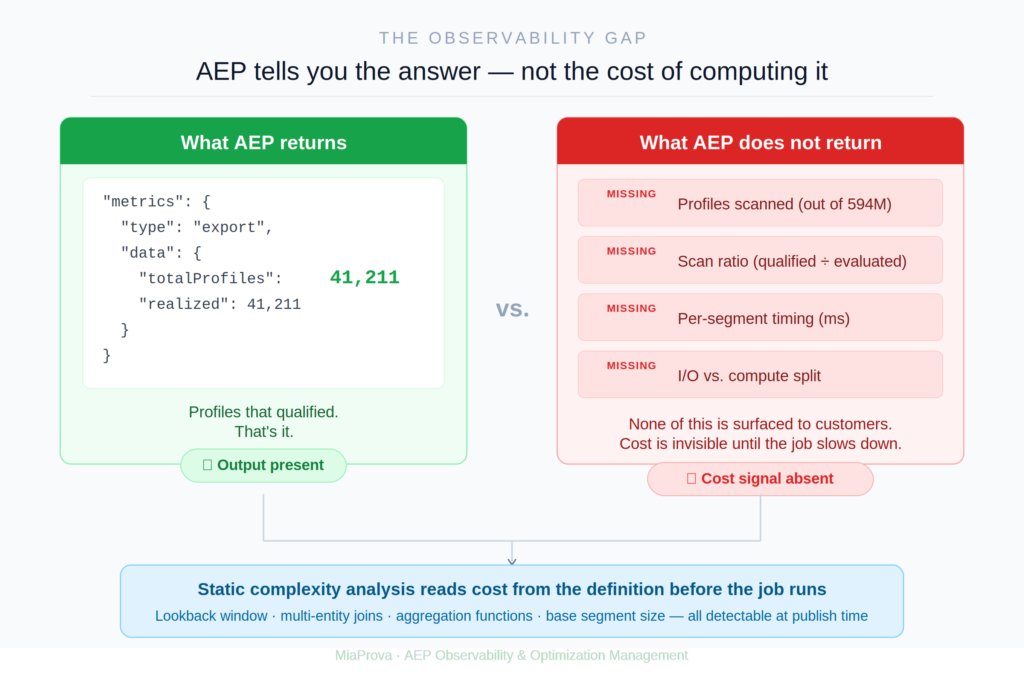
When we pulled the segment definition’s metrics object from the API, here’s what we got:
"metrics": {
    "type": "export",
    "data": {
        "totalProfiles": 41211,
        "totalProfilesByStatus": {
            "realized": 41211
        }
    }
}
41,211 profiles realized. That’s the output, how many profiles qualified. What’s completely absent is any information about how much work was done to produce that result. There’s no profiles-processed count, no scan ratio, no timing data, no cost signal of any kind.
This is the core observability challenge. AEP tells you the answer but not the cost of computing it. A segment that qualifies 41,211 profiles by scanning 600,000 candidates is very different from one that qualifies 41,211 profiles by scanning 594 million candidates. Both produce identical metrics objects.
Fields that would enable a scan ratio calculation, sometimes referred to as profilesProcessed and profilesMatched, are theoretically present on the segment jobs endpoint’s segments array in some org configurations, but they are not consistently populated across AEP deployments and are not documented as stable fields. In practice, they are unreliable as a basis for systematic monitoring.
The practical result: for the vast majority of AEP customers, the cost of a segment definition is invisible until it manifests as a batch job slowdown.
The Broader Implication: Reading Cost From the Definition Itself
The most important takeaway from this investigation isn’t that Credit Segment 4 was expensive. It’s that its cost was entirely predictable from the definition alone, before the batch job ever ran.
Every cost factor in this segment is detectable through static analysis of the PQL expression and definition metadata:
| Signal | Detection Method | Credit Segment 4 |
|---|---|---|
| Lookback window length | temporalConstraint quantity × unit | 720 days |
| Multi-entity lookup join | Lookup class in dataRefPaths | Yes |
| Aggregation function | sum() or count() in PQL | sum() |
| Multi-merge-policy | Distinct values in mergePolicies map | 2 policies |
| Large base dependency | Referenced segment population size | ~7M profiles |
| Performance warning override | overridePerformanceWarnings field | Not overridden |
None of this requires waiting for a job to run. None of it requires AEP to expose timing data it doesn’t currently surface. It requires only reading a segment definition, the same API call MiaProva is already making to populate the segment inventory.
Credit Segment 4 was created at approximately 5pm the day before the batch job ran. If a complexity analysis had scored it at 5:05pm, flagged it as high-risk, and alerted the team, the investigation would have started before the 7-hour job, not after it.
What Good Observability Looks Like Here
This investigation surfaced a clear picture of what AEP practitioners need that isn’t available out of the box today.
A segment publication gate. When a new or modified segment definition appears in the org, score it for complexity before the next batch window opens. Flag definitions that combine long lookback windows, multi-entity joins, aggregation functions, and large base populations. Give the operator an estimate and a concrete recommendation: consider reducing the lookback window to 180 days, or validate this definition in a staging sandbox before publishing to production.
A day-over-day runtime delta on the job KPI. The most actionable signal on the morning of the spike would have been 232 to 436 min (+88%) rather than a static 436 min. The percentage change in context of the prior day communicates immediately that something changed, not just that the job is slow.
A segment change log correlated with job runtime. Which segment definitions were created or modified in the 24 hours before each batch job? Cross-referencing that list with runtime increases would have pointed directly to Credit Segment 4 without any manual investigation.
Honest representation of what the APIs can and cannot tell you. The I/O vs. compute split isn’t available. The per-segment scan ratio isn’t reliably available. Surfacing those gaps clearly, rather than implying they’re accessible somewhere, is itself part of good observability.
What Happened Next
Once Credit Segment 4 was identified as the strongest likely culprit, the remediation path was straightforward. The audience definition was reviewed to determine whether the 720-day lookback was a genuine business requirement or a default that hadn’t been questioned. In most cases, a 2-year purchase history window is far longer than the marketing use case actually requires. A 180-day or 365-day window typically captures the commercially relevant behavior while reducing event scan volume by 75 to 85%.
The lookup class join for product hierarchy is legitimate. The business logic genuinely requires filtering to a specific department and product class. But the join can be optimized by pre-filtering events on event type and transaction type before the lookup is resolved, which reduces the number of records that require the join in the first place.
These are changes that take minutes to make in the Segment Builder. The cost of not surfacing them before publication was 7.3 hours of batch job runtime and a 50-minute narrowing of the activation window margin.
What This Means for AEP and RT-CDP Teams
If you’re running batch segmentation at enterprise scale on AEP, a few things from this investigation are worth keeping in mind.
The batch job clock is shared. Every segment definition in your org runs in the same nightly batch window. A single expensive definition doesn’t just slow its own evaluation. It competes for the same infrastructure resources as every other segment and can slow the entire job. The more sophisticated your segment inventory grows, the more important a complexity review process becomes.
The cost of a segment is invisible in its output metrics. A result of 41,211 qualified profiles tells you the answer. It tells you nothing about what it cost to compute. Until reliable, documented scan ratio data is available from the platform, the only way to understand segment cost proactively is to analyze the definition before it runs.
Timing correlation is a fast first diagnostic. When a batch job spikes with no profile count change, the first question is what changed in the segment inventory in the preceding 24 hours. The updateTime field on segment definitions gives you that list immediately. Sort by most recently updated, filter to the window before the job started, and look at the newest definitions for the cost patterns described above.
The newest audience in your org is the one you know the least about. Mature segments have run hundreds of times. You’ve seen how they behave. A segment published the afternoon before a batch job has no track record, and if nobody scored it for complexity before it ran, you may not know it’s expensive until the next morning.
Closing Thoughts
MiaProva exists because enterprise AEP deployments generate enormous amounts of signal including segmentation jobs, flow runs, skip rates, activation gaps, and error codes, and none of it is consolidated, trended, or actionable without dedicated tooling. The Daily Batch Job Monitor caught this issue not because it predicted it, but because it made the anomaly impossible to miss. The investigation that followed is the work of practitioners who understand both the AEP API surface and the areas where additional visibility would help teams move faster and with more confidence.
Building around those gaps is what observability at this layer actually means.
MiaProva is an AEP observability, monitoring, and optimization management platform built for teams running Adobe Experience Platform at enterprise scale. Learn more at miaprova.com.