We Analyzed Nearly 40,000 Adobe Target Activities. Here’s What We Learned.
Enterprise optimization programs have scaled their execution far faster than their ability to manage, measure, and learn from it.
That’s the central finding from our analysis of 39,596 Adobe Target activities across ten enterprise programs in retail, financial services, nonprofit, and B2B technology, with histories reaching back to 2009. All customer names, personal identifiers, and activity IDs were removed.
We didn’t examine test results or business outcomes. We looked at the operational structure of the programs: what teams create, which activity types they use, how long activities stay live, and how programs change over time. Seven patterns stood out.
This is the same audit we run at the start of every MiaProva engagement. Before we configure anything, we pull the organization’s full Target history and look at how the program actually operates. Here, we’ve aggregated that analysis across ten programs.
1. Optimization has become an operational machine
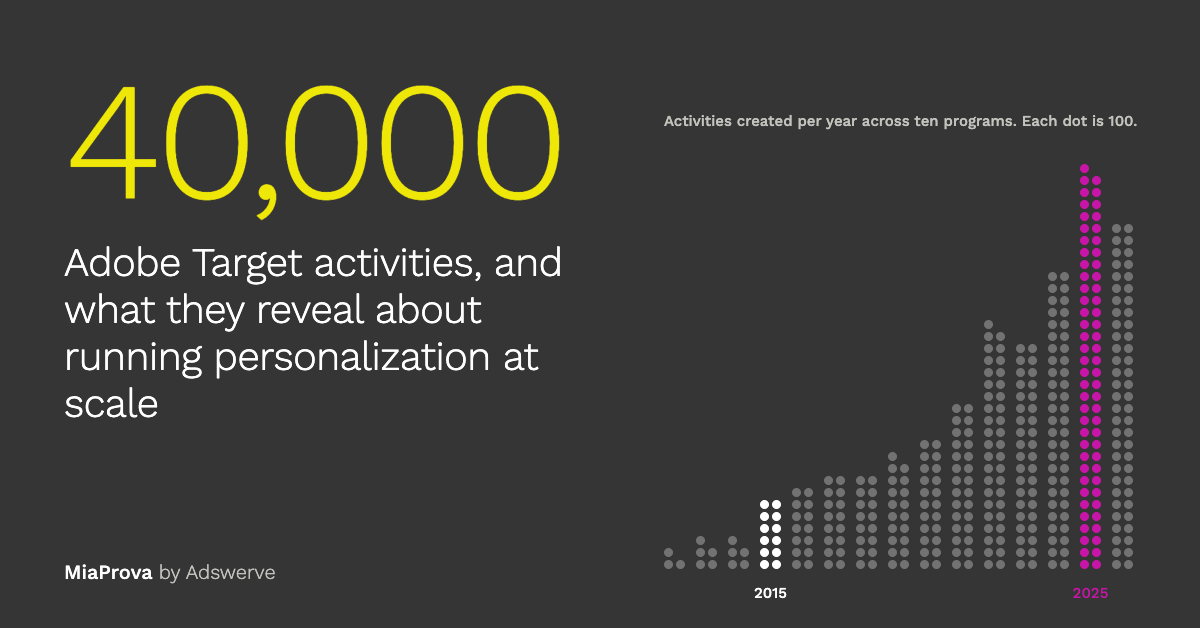
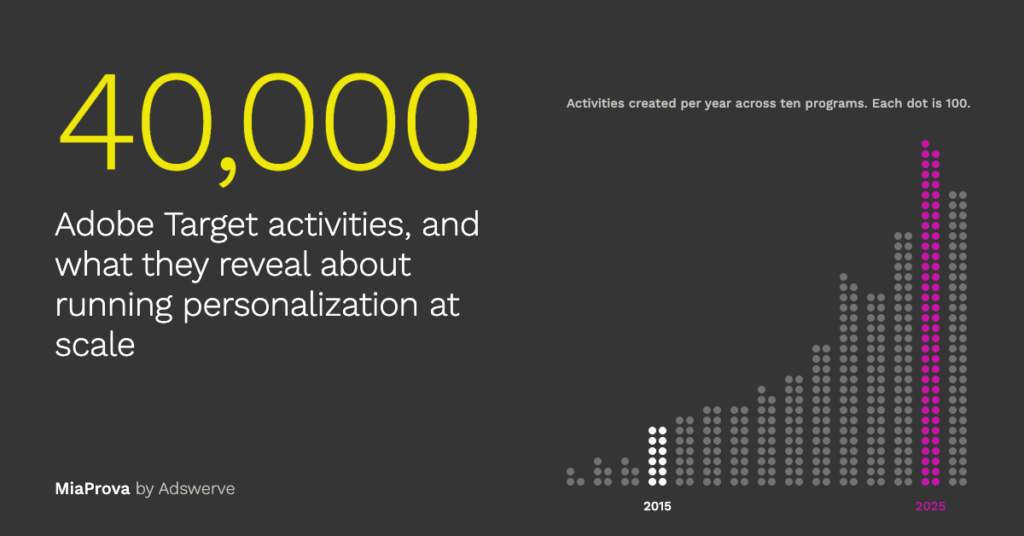
In 2015, the ten organizations created 1,183 Adobe Target activities combined. In 2025, they created 6,676: a 5.6× increase in a decade.
The growth is concentrated. Two retailers created 5,406 of those 2025 activities, nearly three times the whole group’s annual volume in any year before 2020.
Activities created per year grew 5.6× from 2015 to 2025
1,183 activities in 2015, 6,676 in 2025, across ten enterprise Adobe Target programs. The lighter bar is 2026 through early November.
That growth shows how deeply optimization is now embedded in digital operations. It also exposes a gap. Target was built to execute experiments and personalized experiences. Its activity list shows individual activities, not a program.
At thousands of activities across teams, sites, and business units, basic questions get hard. How many experiments are we running? Which objectives do they support? What have we learned? What has the program actually delivered? Most teams answer with spreadsheets, project trackers, and hand-built slides.
The takeaway: Scaling execution doesn’t scale management. The bigger the program, the more each activity needs to be tied to an objective, an owner, prior learnings, and a measured outcome.
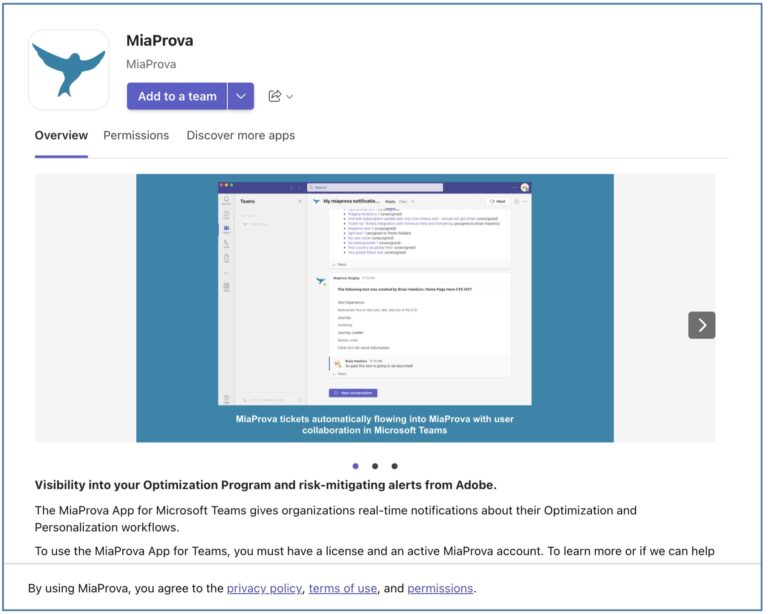
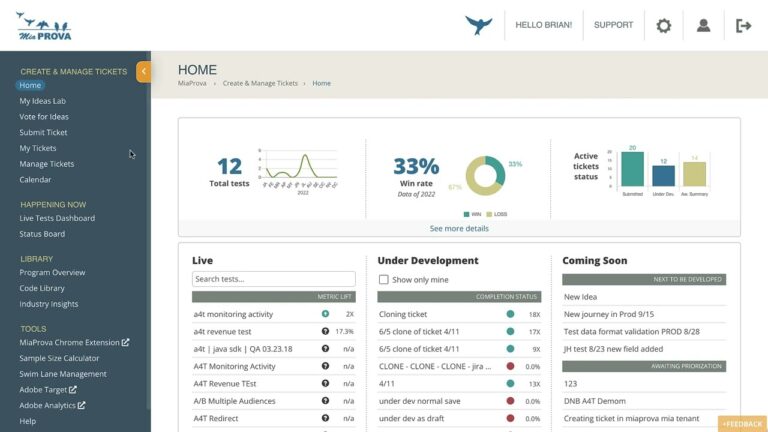
How MiaProva helps: MiaProva rolls every Target activity, across workspaces, sites, and business units, into one program view. Each activity is tied to its hypothesis, objective, owner, and results, so questions like how many tests are running and what they have delivered become a filter, not a week of spreadsheet work.
2. Experience Targeting is replacing experimentation
In 2015, Experience Targeting (XT) accounted for 18% of new Target activities. So far in 2026, it accounts for about 75%. Traditional A/B tests make up roughly one in five.
Experience Targeting rose from 18% to 75% of new activities
Share of each year’s new activities, all ten programs, 2012–2026.
That’s a real shift. Programs once built around hypothesis, test, and rollout are increasingly delivering chosen experiences straight to defined audiences.
That isn’t a problem in itself. It means personalization has become operational. But an XT activity has no randomized control group, so a program can multiply its personalization without learning anything about incremental impact. Some XT activities roll out proven winners. Others come from promotional calendars or stakeholder requests. Without a link to the original hypothesis and evidence, you can’t tell which is which.
The takeaway: Personalization at scale is an accountability problem. Teams need to know not just what is being delivered, but why it exists and what evidence supports it.
How MiaProva helps: Every XT activity can carry its lineage in MiaProva: the experiment it came from, the evidence behind it, or the business request that created it. Teams can see which personalized experiences are backed by a test and which aren’t, and pick the high-traffic ones that deserve a holdout to prove their value.
3. The ghost fleet: live activities nobody is watching
Of 11,694 activities in an approved state, 2,405 had no end date and were more than a year old, roughly one in five. In one organization, the median age of these open-ended activities was over five years.
Another 7,607 approved activities had end dates already in the past. Those generally aren’t serving anything, but they clutter the inventory and make it harder to see what’s actually running. Together, the two groups make up 86% of approved activities.
86% of “approved” activities are expired or open-ended for over a year
What each program’s 11,694 approved activities really are, as of each program’s latest change.
The open-ended group is where the risk lives. Some are intentional: evergreen personalization, permanent audience experiences, standing business requirements. Others are forgotten tests, stale promotions, or experiences whose owners have moved on. Activity metadata alone can’t tell them apart. That’s the problem.
It also matters for what customers see. When several activities qualify for the same location and visitor, Target picks one by priority. A five-year-old, high-priority XT activity can quietly outrank this week’s campaign, and nobody may remember it’s there.
The takeaway: Approved doesn’t mean it should still be running. Mature programs need lifecycle management: named owners, scheduled expiration reviews, change history, and accountability for every live activity.
How MiaProva helps: MiaProva monitors the full approved inventory and alerts owners by email, Slack, or Teams when an activity runs past its end date, stays open-ended long after launch, or has no clear owner. Priority and location context show which old activities could be outranking current campaigns, so stale experiences get reviewed, renewed, or retired on a schedule instead of during an incident.
4. Nearly a third of A/B tests are scheduled for less than a week
We looked at 15,595 A/B tests with scheduled start and end dates. 32% were scheduled for under seven days, and 10% for under one day. The median was about 22 days.
Programs varied widely. At one retailer, 58% of A/B tests were scheduled to end within a week. At another organization, only 5% were.
A third of A/B tests were scheduled for under a week
32% of 15,595 A/B tests were scheduled for less than a full week; 10% in under a day.
Short doesn’t mean invalid. Validity depends on traffic, sample size, effect size, design, and stopping rules, not duration alone. Sub-day activities are most likely QA, technical validation, or the A/B type used for something that isn’t really a test. And because these are scheduled dates, actual run times may differ.
Still, a test that doesn’t span a full week is exposed to weekday-versus-weekend swings. The bigger question is whether teams share standards for when a test has enough evidence to support a decision. At enterprise scale, those standards can’t live in individual practitioners’ heads.
The takeaway: Velocity isn’t maturity. The goal isn’t fewer tests. It’s repeatable standards for design, monitoring, and decisions, so more tests produce more reliable learning.
How MiaProva helps: Programs define their standards once in MiaProva (minimum duration, sample size, primary metric, stopping rules) and every test is checked against them, so a test scheduled to end before a full weekly cycle gets flagged before it launches, not after a decision. Results are read with confidence intervals and sample ratio mismatch checks, so every decision clears the same evidence bar no matter who ran the test.
5. Target’s machine learning is barely used
Auto-Allocate, Auto-Target, and Recommendations make up just 2.6% of the activity inventory. Outside two B2B technology organizations, no program used them for even 5% of its activities.
Machine-learning activity types are 2.6% of all activities
Share of each program’s activities using Auto-Allocate, Auto-Target or Recommendations. Only two programs pass one in ten.
That’s a count of activities, not traffic. ML activities tend to be long-lived and high-volume, and a single Recommendations activity can serve many placements, so their share of delivered experiences is likely higher. Even so, the gap between the industry’s enthusiasm for AI and its actual use in these programs is wide.
The data doesn’t say why. From experience, the usual barriers are traffic, clear success metrics, suitable use cases, and trust in how decisions get made. The harder problem is knowing where ML fits: which placements have the traffic, where dynamic allocation beats a fixed split, which past experiments point to personalization opportunities. Those are program-level questions, not activity-level ones.
The takeaway: AI-driven optimization needs operational intelligence first. The next step isn’t more AI features. It’s knowing where to apply them and how to judge the results.
How MiaProva helps: Because MiaProva holds the full history of activities, locations, and results, it can point to where machine learning is likely to pay off: high-traffic locations, A/B tests where different segments preferred different experiences, and long-running XT activities that could become Auto-Target. MiaProva’s AI agents, connected to Target and Analytics through MCP, let teams ask those questions in plain language across years of program data.
6. For retailers, optimization runs on the merchandising calendar
Most programs launched activities during the workweek. Two of the largest retailers didn’t: 35% and 24% of their launches were scheduled for Sundays, many around midnight Eastern, at the turn of a new promotional week. At one retailer, 157 activities were scheduled to launch within a single hour.
The two largest retailers launch on Sundays
Share of each program’s launches by day of week. Retailers A and B start 35% and 24% of activities on Sunday, mostly at midnight Eastern.
For these retailers, Target isn’t just an experimentation tool. It’s part of the machinery that ships weekly promotions, offers, and merchandising.
We didn’t analyze placement or audience overlap, so concentrated launches don’t prove conflicts. But when 157 activities go live in an hour, teams need to know what’s scheduled, where it will appear, what it overlaps with, and who resolves collisions before customers see the result.
The takeaway: Optimization is now a business operations discipline. Planning and coordination matter as much as testing and reporting.
How MiaProva helps: The MiaProva calendar shows every scheduled Target activity by day, week, and month, alongside planned work from tickets, so a Sunday launch wave is visible well before it goes live. Conflict alerts flag activities competing for the same location and audience, so priority gets settled by the team, not by whichever activity Target happens to pick.
7. Program knowledge sits with very few people
Target records who last modified each activity. In six of the ten programs, the two most frequent last editors account for more than half of all activities with a recorded editor. In the most concentrated program, it’s 96%. Several programs also had thousands of activities with no recorded editor.
In six of ten programs, two people last modified most activities
Share of each program’s activities last modified by its two most frequent editors.
This is the last editor, not the full history, so it doesn’t mean two people made every change. But anyone who has run a mature Target program knows the pattern: one or two people who remember why an activity exists, why an audience is excluded, why a metric was chosen, why something was never turned off.
That knowledge is valuable, and fragile. When those people change roles, who can explain the program? Where are the original hypotheses and results?
The takeaway: Programs need institutional memory. Ownership, history, and searchable learnings aren’t administrative overhead. They’re how a program survives turnover.
How MiaProva helps: MiaProva keeps the why next to the what: hypothesis, decision, outcome, owner, and change history for every activity, plus context pulled from Workfront and Jira. Program memory lives in a searchable system instead of two people’s heads, and AI agents can answer why an activity exists for whoever inherits it.
The bigger story: execution has outpaced intelligence
Taken together, the findings show enterprise optimization evolving from a collection of experiments into a large-scale experience delivery operation.
| What has changed | The challenge it creates | How MiaProva addresses it |
|---|---|---|
| Activity creation up 5.6× in a decade | Program-wide visibility | One program view, every activity tied to objective, owner, and results |
| XT is ~75% of new activities | Accountability for personalization | Lineage from each XT activity back to its test or request |
| ~1 in 5 approved activities are open-ended and over a year old | Lifecycle management | Expiration and ownership alerts, scheduled lifecycle reviews |
| 32% of A/B tests scheduled for under a week | Consistent experimentation standards | Shared test standards checked before launch |
| ML-driven activity types are 2.6% of the inventory | Knowing where automation fits | History-driven recommendations for where ML fits |
| Retailers launch in large weekly waves | Coordination and conflict prevention | Calendar view and conflict alerts |
| A few people maintain most activities | Institutional knowledge | Searchable hypotheses, decisions, and change history |
None of this means these programs are failing. They’re doing more with Target than ever. The tools, processes, and reporting around that work just haven’t kept pace, and the gap widens as programs grow.
The industry has spent years on execution: launch more tests, personalize more experiences, automate more decisions. The next stage is about seeing, explaining, and proving what all that activity is worth. Running more activities was never the goal. Better decisions and measurable business impact are.
Where MiaProva fits
Adobe Target is a powerful execution engine for experimentation, targeting, recommendations, and automated personalization. Every pattern above is a sign of programs using it heavily. What’s missing is the layer that turns thousands of individual activities into a managed program.
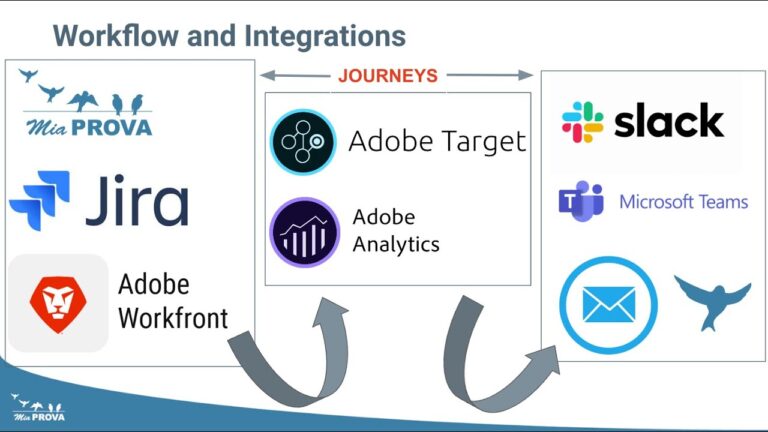
That’s the layer MiaProva provides. It connects to Target through the Admin API and ties each activity to its hypothesis, business objective, owner, metrics, and results. It monitors the live inventory and alerts teams to expired, open-ended, conflicting, and under-powered activities. It brings in context from Adobe Analytics, Workfront, and Jira. And its AI agents, connected through MCP to Target, Analytics, and the rest of the Adobe stack, help teams investigate issues, mine years of experimentation history, and decide what to test next.
It also starts the same way this post did. Every MiaProva engagement begins with an audit of the organization’s Target history: the open-ended inventory, test duration profile, launch concentration, ownership, and how much personalization traces back to evidence. That audit sets the first priorities and gives the program a baseline to measure progress against.
The goal isn’t to help you launch more activities. It’s to help you understand, manage, and get full value from the ones you already run. As programs keep scaling, the advantage will go to the teams that turn that volume into measurable, repeatable outcomes.
Five questions to ask about your own program
- What is actually live right now? Can you tell intentional always-on experiences apart from activities nobody has revisited?
- How much of your personalization is backed by evidence? Can you link targeting activities to prior experiments, hypotheses, or a measurement plan?
- Are your experimentation standards consistent? Do teams follow shared rules for duration, sample size, evaluation, and stopping?
- Where could automation help? Do you know which high-traffic placements and past experiments suit ML-driven optimization?
- Could someone new understand your program tomorrow? Are hypotheses, decisions, outcomes, owners, and learnings easy to find?
If these are hard to answer, you’re not alone. We’ll run the same audit on your Adobe Target program and walk you through what it shows: what’s really live, where your standards drift, who holds the knowledge, and where the biggest opportunities are hiding in the activities you already run.
About the analysis
This analysis covers 39,596 Adobe Target activities exported through the Adobe Target Admin API in November 2026, from ten enterprise programs: three retail, two financial services, two nonprofit, and three B2B technology. Activity histories go back to 2009. Customer names, personal information, and activity IDs were removed, and no organization is identified.
We examined activity metadata only: activity type, status, creation date, scheduled start and end dates, and last-recorded editor. Durations and launch times are based on scheduled dates, not observed delivery. Day-of-week and time-of-day figures use US Eastern time.
Results, traffic, audiences, offers, and business outcomes were not included, so this analysis doesn’t establish win rates, lift, actual activity conflicts, or why organizations chose particular activity types. The 2026 figures reflect a partial year. Findings describe these ten programs and shouldn’t be read as representative of all Adobe Target customers.