A large financial organization handed us their pain point list. Here is how MiaProva answered it.
The best discovery calls are the ones the prospect runs for you.
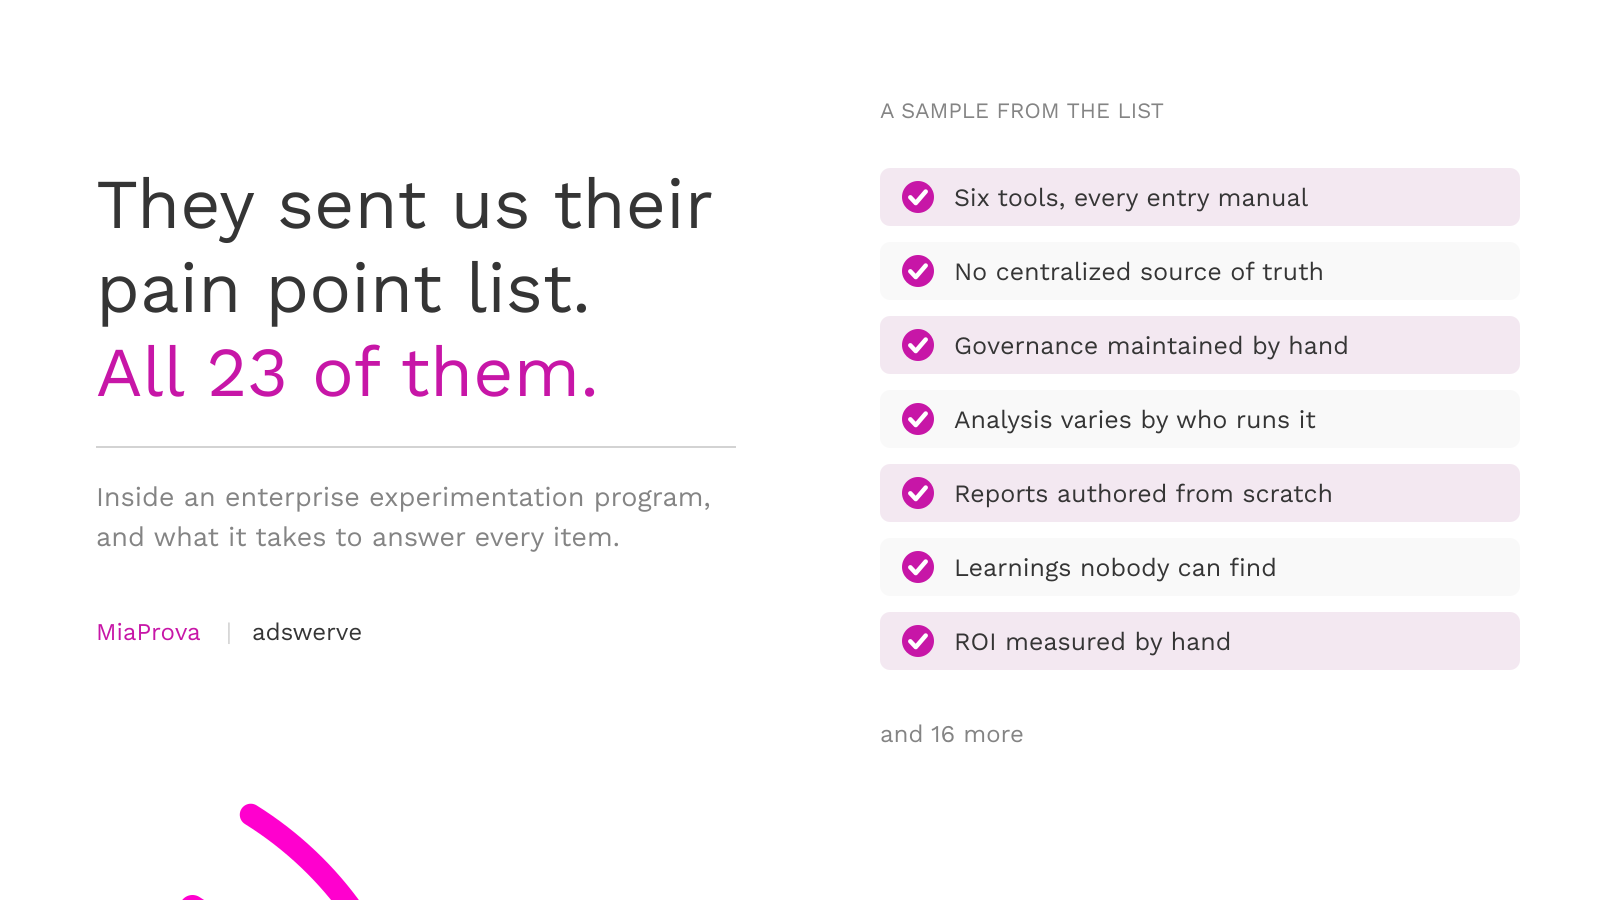
A large financial organization evaluating MiaProva recently sent us a spreadsheet. No slideware, no vendor questionnaire. Just an honest inventory of how their digital experimentation program actually operates: 23 pain points, each with a problem statement and the business impact behind it. It is one of the clearest pictures of enterprise experimentation operations we have seen, and it will feel familiar to almost every optimization team running on Adobe Target.
They gave us their challenges in their own words. Here is what they told us, and how MiaProva answers it.
The program runs on six tools, and every entry is manual
The first pain point on the list explains most of the others. Their experimentation program is managed across six tools: a spreadsheet platform for intake and experiment details, a wiki for experiment reports and the results repository, a ticketing system for project management and workflow, Adobe Target for setup, Adobe Analytics for measurement, and Excel for confidence calculations and statistical significance.
None of these tools are connected. Every piece of experiment data is entered by hand, then entered again somewhere else. Their words, not ours: it creates potential for error and misalignment, a fragmented view of experiment statuses and outcomes, and excessive time spent maintaining data rather than driving insights.
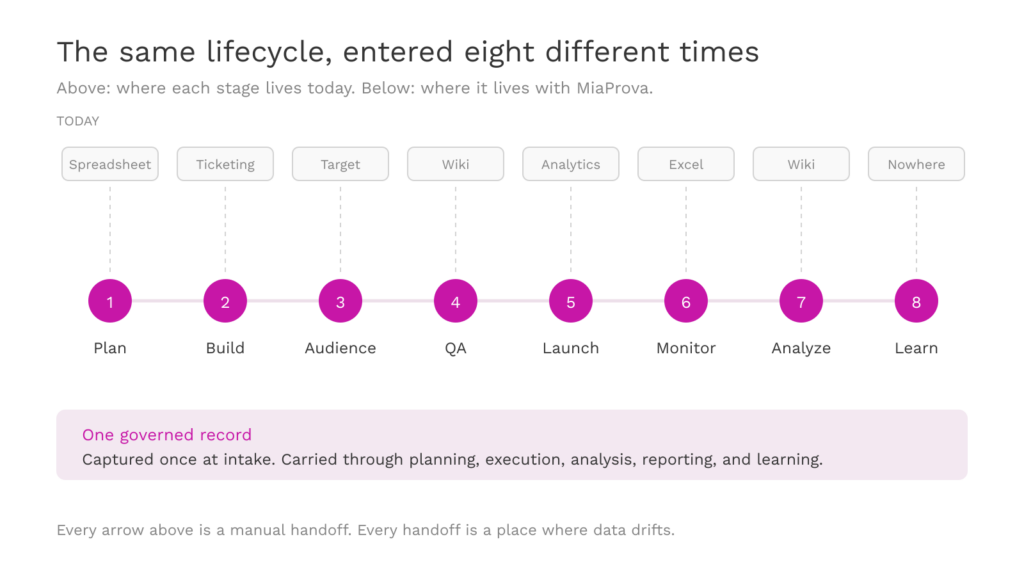
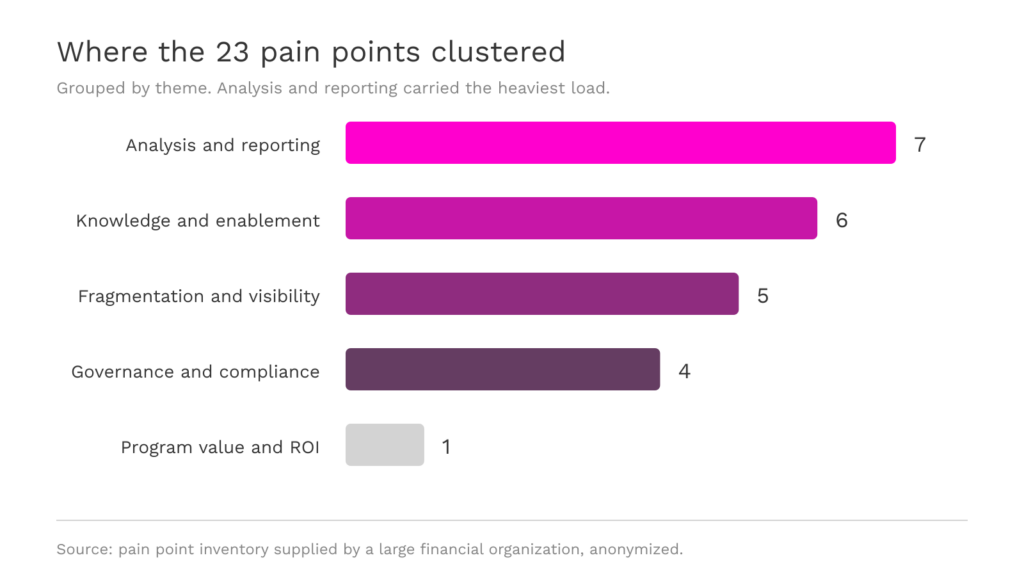
The tools are fine. The seams between them are the problem. Every manual handoff is a place where data drifts, statuses go stale, and reporting falls behind. When we grouped the list by theme, the shape of the problem became clear. Analysis and reporting carried the heaviest load at seven items, knowledge and enablement six, fragmentation and visibility five, governance four, and program-level ROI one. Different symptoms, one root cause: the program has no single home, so people have become the integration layer.
One system of record
MiaProva’s answer to the fragmentation theme is simple to state. Capture experiment data once, then reuse it through the entire lifecycle.
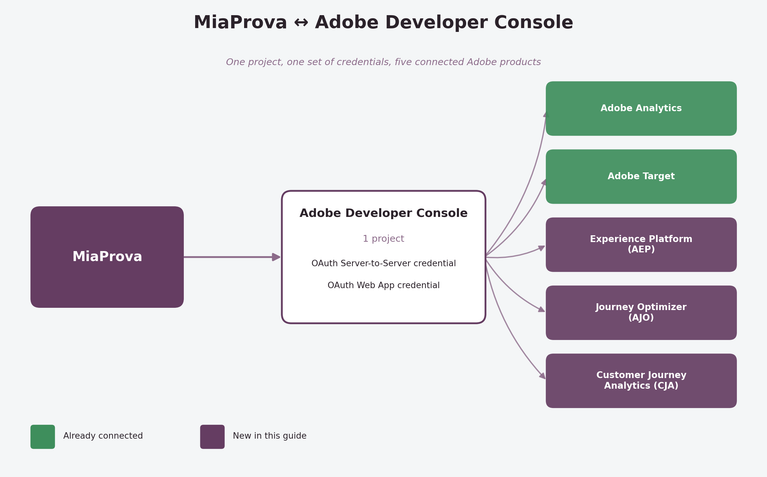
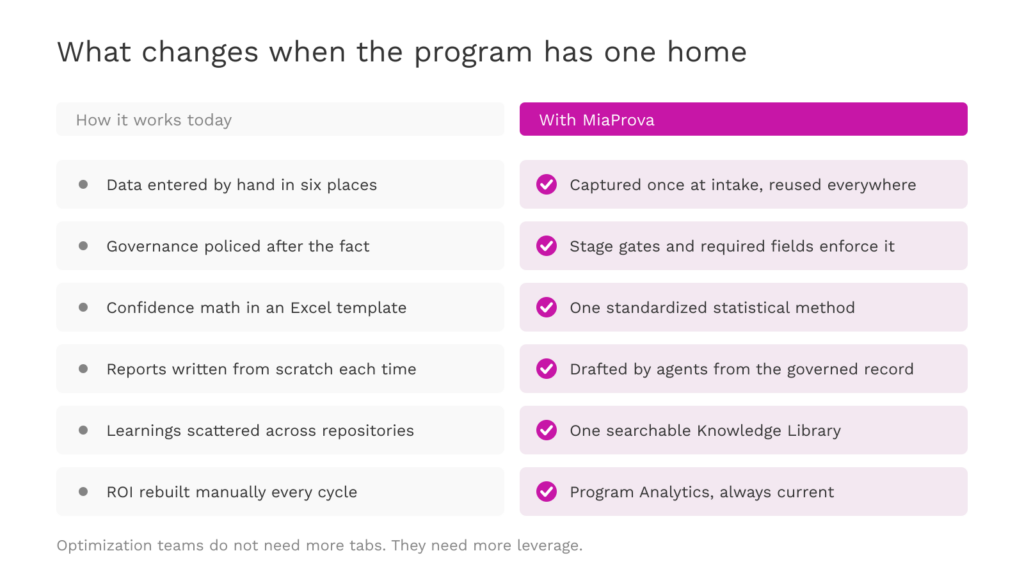
Intake happens through standardized tickets with templates, required fields, prioritization, ownership, and status tracking. That same record carries forward into a living experiment report and a searchable Knowledge Library holding hypotheses, outcomes, decisions, and learnings. Jira connects for delivery workflow. Adobe Target connects for activity metadata and execution details. Adobe Analytics, A4T, and CJA connect for metrics and results. Governed analysis agents replace the Excel templates.
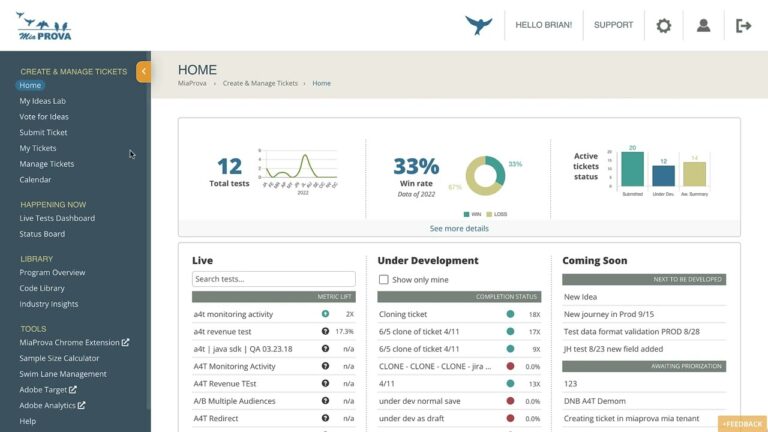
This matters beyond the core team. The organization flagged that more of their business units are starting to test, some through outside vendors, and there is no centralized source of truth across any of it. MiaProva becomes the system of record for all of it: the central program, partner teams, and vendors, all following the same taxonomy, workflow, ownership, and reporting standards. Live dashboards show what is planned, running, blocked, or awaiting a decision, so nobody has to check five tools to answer the question “what is live on the site right now?”
Governance that the workflow enforces
Three separate pain points on the list were governance problems wearing different clothes. Governance relies on manual processes that someone has to maintain. Compliance checks depend on human oversight rather than embedded controls. And across the broader organization, the only cross-team reference is Adobe Target itself or a manually maintained spreadsheet report.
Our position: governance works when the workflow does the enforcing. In MiaProva, stage gates, required fields, approvals, QA checklists, measurement plans, and audit history live inside the experiment lifecycle. Compliance stops being an after-the-fact inspection and becomes a property of the process. Shared standards, permissions, and naming conventions extend that same layer across teams and business units, which is what makes cross-team oversight scalable instead of heroic.
Analysis and reporting without the grind
The heaviest recurring costs on the list were analytical. Analysis happens across Adobe Analytics, Excel, and a general-purpose AI copilot, manually, with results that vary based on who runs them. Confidence calculations go through an Excel template that requires training to use. Every experiment report is authored by hand. Stakeholder reporting means aggregating data from multiple sources, validating it, updating trackers, and then building the deck.
MiaProva combines connected Adobe data with standardized test-analysis agents, reusable prompts, and consistent reporting templates. Lift, confidence, and outcome quality come from the same methodology every time, regardless of the analyst’s statistical background. Consistency in results stops being a training program and becomes a platform property.
The reporting story follows directly. Because each experiment maintains a living record from intake through decision, the report largely writes itself. The same governed record produces the executive summary, the comprehensive results narrative, the presentation, and the portfolio dashboard.
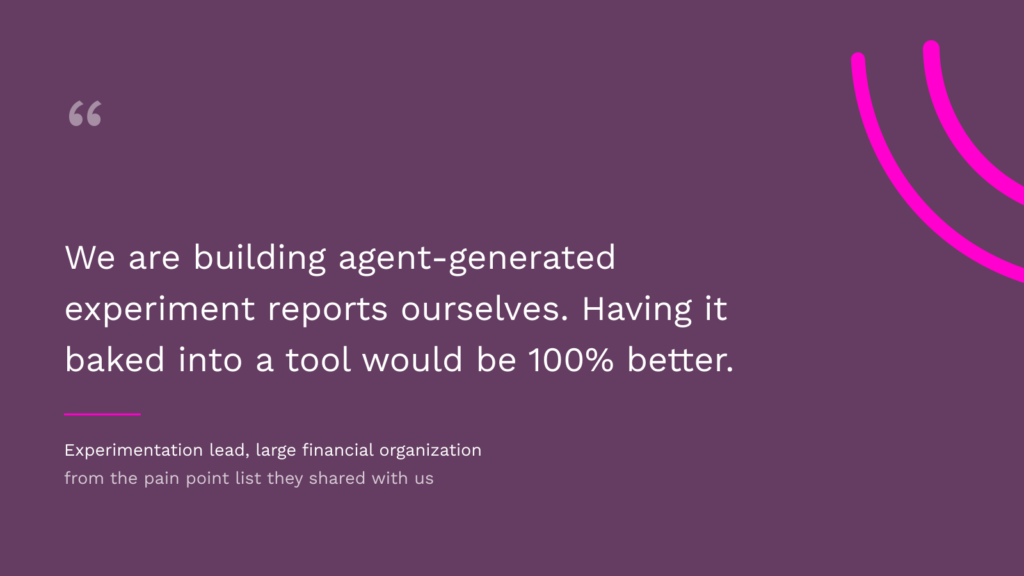
One moment from their list is worth calling out. They told us they are actively building agent-generated experiment reports internally, and that having the capability baked into a tool would be, in their words, 100 percent better. We agree. MiaProva’s test-analysis agents draft the executive summary, detailed findings, interpretation, recommendations, and next steps, and the output stays attached to the governed experiment record. The capability they were about to build is already in the product, with nothing for their team to host or maintain.
Knowledge that compounds, self-service that scales
The remaining themes were about leverage. Institutional knowledge is scattered across repositories and formats, so past learnings rarely inform future tests. A test you cannot find is a test you will pay to run twice. MiaProva’s Knowledge Library centralizes hypotheses, outcomes, decisions, and learnings in a consistent structure, with search, tags, and natural-language access, and the AI agents reference that history when proposing next-best tests.
They also want to democratize experimentation, but the current process is too heavy to hand to teams outside the core group, and comfort levels vary widely. This is a tooling problem more than a training problem. Guided intake, reusable templates, prompt libraries, role-based workflows, and embedded approval gates give business teams a supported self-service path while the central team keeps visibility, standards, and control. Democratization fails without guardrails. MiaProva ships the guardrails.
And finally, the pain point every program leader recognizes: proving the value of experimentation is manual, difficult, and slow. MiaProva’s Program Analytics aggregates volume, outcomes, lift, value, velocity, win rates, and business impact across portfolios, journeys, teams, and time periods. That is the view that turns an experimentation team from a cost center conversation into a value conversation with leadership.
What this engagement taught us
Nothing on this organization’s list was unique to them, and that is the point. Fragmented tooling, manual governance, inconsistent analysis, labor-intensive reporting, scattered learnings, and a self-service ambition without the platform to support it: this is the standard operating condition of enterprise experimentation programs today.
The teams are not the problem. The operating model is. Optimization teams do not need more tabs. They need more leverage.
If parts of this list sound like your program, we should talk. Bring your own pain point list. We will go through it the same way, item by item.