Historically, MiaProva would only provide Adobe Target usage reports from when they started using MiaProva. We have since changed that and now provide reporting on their usage of Adobe Target since they started using it. Many of our customers have been using Target since 2010 or even earlier!
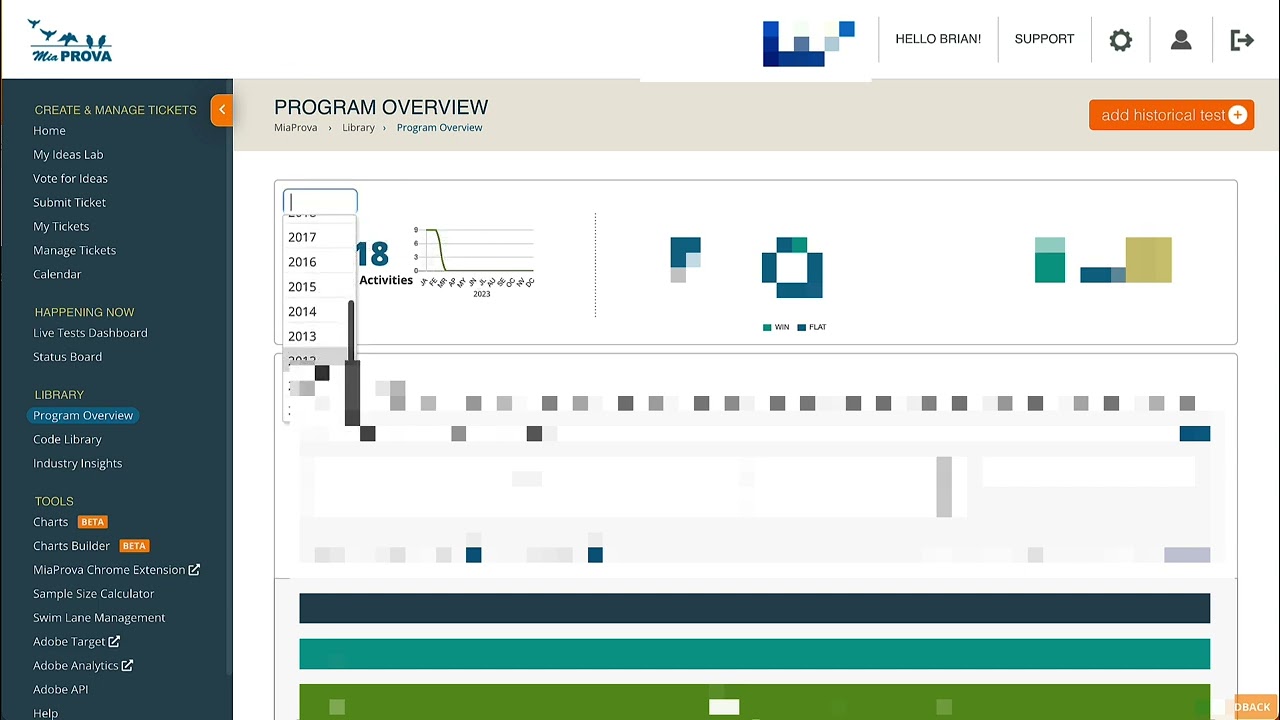
The video is about a new feature in MiaProva’s last release which allows customers to view year-over-year reports on how they are using Adobe Target, including activity throughput. The report filters can be applied to exclude QA activities. The feature has been updated to go back to the beginning of the company’s relationship with Adobe Target. MiaProva’s tools for efficiencies and scale have helped many customers to run lots of activities year over year. The speaker encourages MiaProva customers to check out this new feature.
Transcript: (00:00) here’s a quick video on a small little feature that we incorporated with our last release that a couple customers that provided a few that I saw that was super cool so I thought I’d do a video to show so um what you’re seeing here is um just a report in terms of how you’re using Adobe Target and year over year um reporting in terms of activity throughput and historically what we’ve done is only started the year of the graph when Mia Provo when the company first started using miaprova but we’ve (00:33) since updated to go back all the way in time since the Adobe Target relationship at the organization started and so I thought it’d be interesting to kind of show you know some of this so here’s here’s an organization using Adobe Target since 2010 you can see the kind of the progression year over year so MIA purple customers give this a look um your report filters that you apply within here so when you want to filter out activities like QA that’ll apply on the data set as well so you can you kind (01:02) of see your company’s growth and the companies that are doing like lots of testing as you see here Mia Prova obviously helps with this you know with our standardization our tools for efficiencies and scale and so you’ll see a lot of companies out here that’ll have lots of companies or lots of activities run year over year and me and Prova is playing a big role in in helping scale that out here you can see some of these customers you know a thousand activities year over year um you know some years less but then you (01:37) know so far this year 223 different activities 1809 activities last year so exciting stuff Mia program customers go ahead take that a look um thank you
This video will maybe help those Adobe Target users with debugging or validating the Geo-Targeting capabilities within Adobe Target. We wrote this blog post some time ago that allows users to see what Adobe Target Geo meta-data is mapped to your IP address and that has generated many inquiries to us and we hope this video helps with that.
Blog Post: https://www.miaprova.com/blog/adobe-target-geo-targeting/
Debugging Example URL (remember to go incognito or clear cookies to spoof your IP address): https://www.miaprova.com/blog/adobe-target-geo-targeting/?mboxOverride.browserIp=149.142.201.252
One of our customers here at MiaProva is expanding their testing efforts and use of Adobe Target well beyond their www and mobile site. They are bringing Adobe Target to their Email Platform, and we are helping them do so. The magic that is making this possible is Adobe Target’s Delivery API. You have to…
MiaProva enables organizations to quickly and easily highlight the direct impact tests are making on organizational goals. Users of MiaProva can also make use of a wide array of strategic filters to make test review and communication seamless.
Successful testing programs require strong collaboration across cross-functional teams. With the MiaProva platform, we have built in various features to seamlessly make collaboration easier. With an easy to use interface, testing managers can increase stakeholder buy-in and promote efficiency in the testing process, starting from ideation all the way through knowledge sharing. Generating and sharing…
Here we address a measure slack question regarding how the mbox3rdPartyId is stiched to Activities and Adobe Target will always show each mbox3rdPartyId their original assignment.