Beyond Batch Windows: Scoring the True Complexity of AEP Audiences
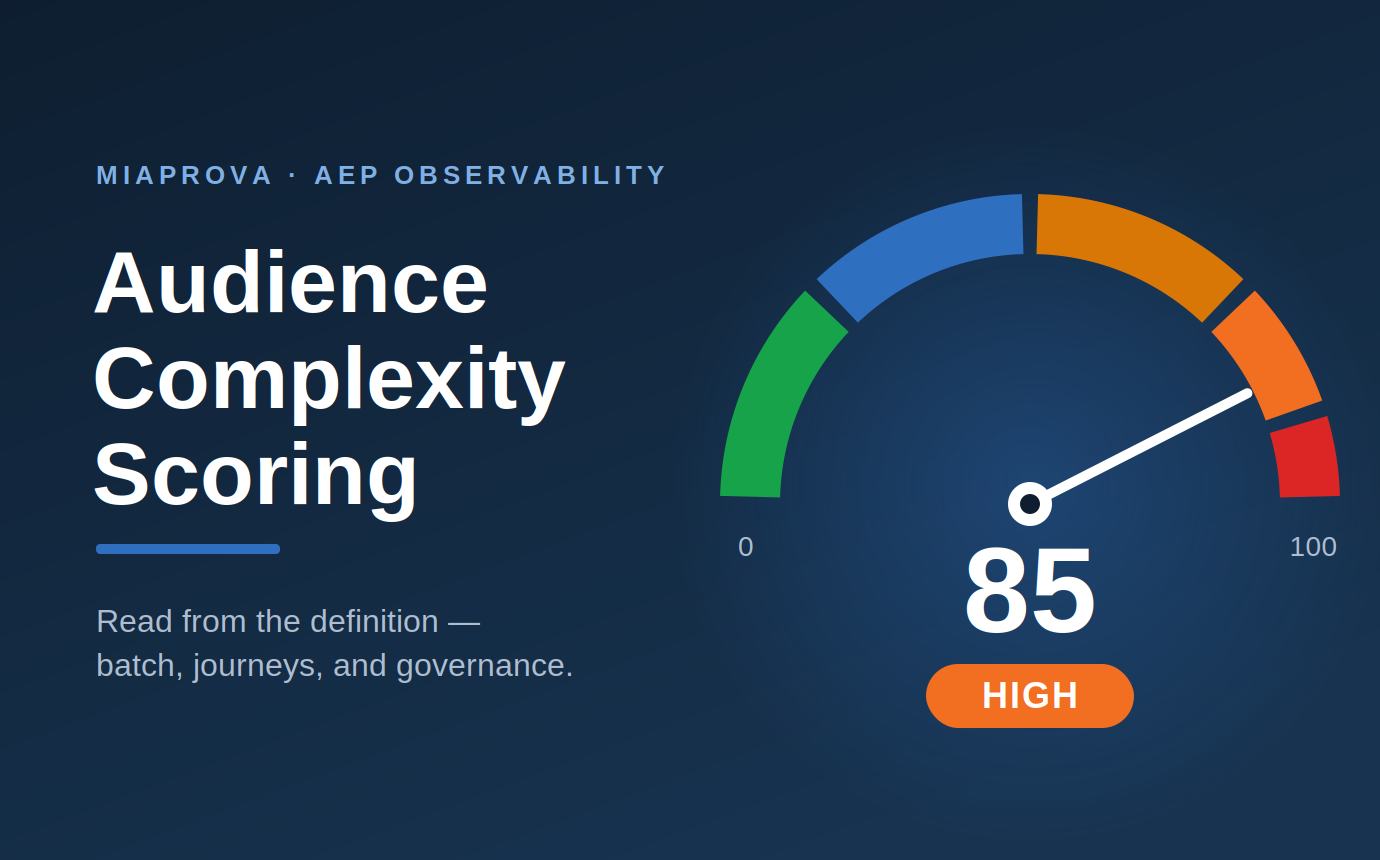
Introducing Audience Complexity Scoring in MiaProva: a 0–100 cost and risk score read directly from the audience definition.
It started as a way to protect the nightly batch job.
It turned into a much bigger signal — because the same characteristics that make an Adobe Experience Platform audience expensive to evaluate (long lookbacks, aggregations, joins, exclusions, nested dependencies) also tell you something important about journeys, freshness, consent, governance, and architecture.
In other words: batch runtime is only the first symptom. The audience definition is where the risk begins.
The audience that made this obvious
A while back, I wrote about a client’s nightly batch segmentation job that took 7.3 hours instead of the usual 3.5 — even though the total profile count was actually down slightly from the night before.
The culprit was a single audience, published around 5 p.m. the afternoon before. It combined a 720-day lookback window, a multi-entity lookup join, a filtered sum aggregation, and a large base dependency. We called it Credit Segment 4.
That investigation led to two posts: Why Your Most Expensive AEP Audience Might Be Your Newest One and the follow-up, The Right Fix for Expensive AEP Segments: Move the Math Upstream.
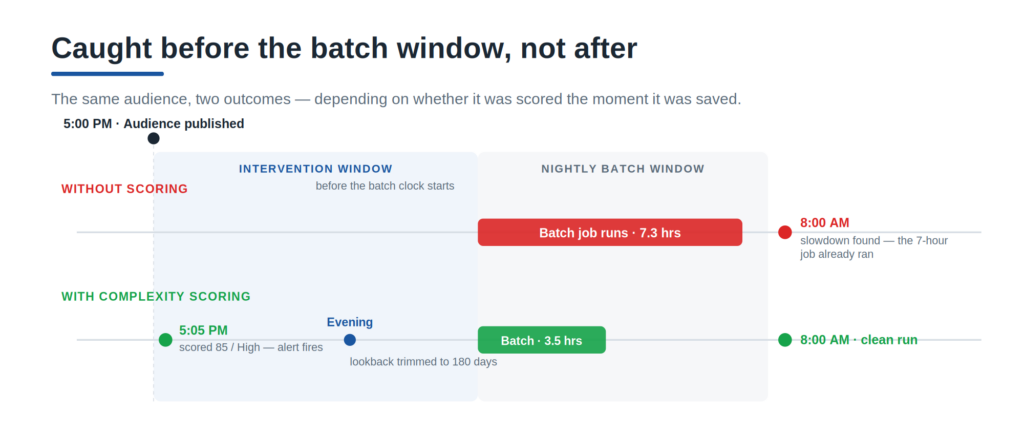
But the part I couldn’t stop thinking about was this: the cost of that audience was predictable before the batch job ever ran. Every expensive characteristic was sitting right there in the audience definition JSON that MiaProva was already pulling into the segment inventory. Nobody had to wait seven hours to discover it was expensive. The information existed at 5:05 p.m.
So we built the thing that reads it. And once we did, we realized the batch window was only the first place this signal pays off.
What we built
Audience Complexity Scoring assigns every AEP audience definition a 0–100 score derived from static analysis of the definition itself. No batch job has to run. No runtime telemetry is required. No population polling is needed.
The score is computed when an audience is created or modified, from the same definition payload MiaProva already reads to build the audience inventory. A definition saved at 5:05 p.m. is scored at 5:05 p.m. — well ahead of the next batch window.
That is the key design principle: the score is preventive, not diagnostic. It is meant to tell a practitioner, architect, or marketer “this audience is likely to be expensive or risky” before that audience slows a batch job, delays a journey, or creates a governance problem downstream.
The six signals
Audience Complexity Scoring is built from six independent signals. Each one maps to a specific, well-understood driver of audience evaluation cost or operational risk.
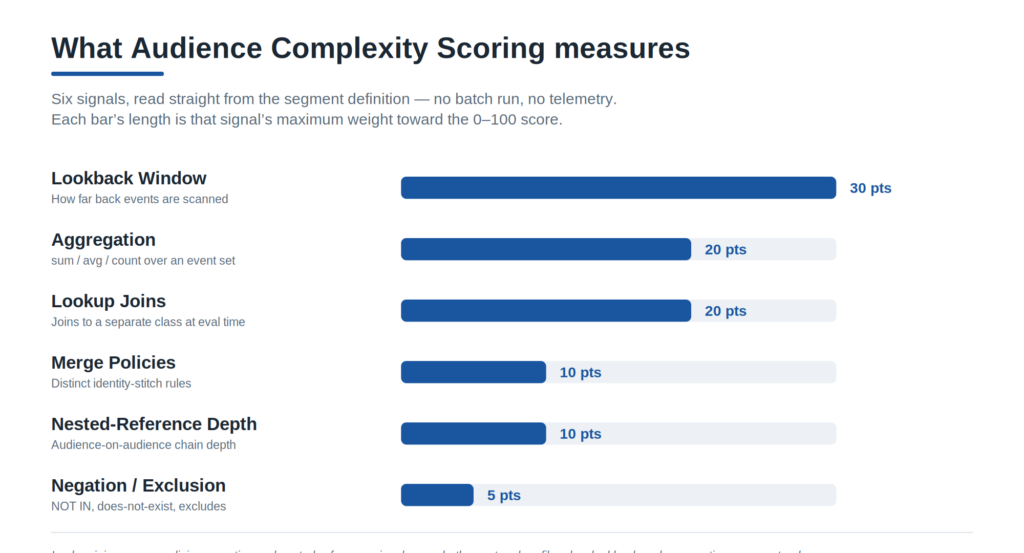
1. Lookback window length: 0–30 points
This is the highest-weighted signal, because event scan volume grows with the window and multiplies almost every other event-based cost. A 7-day lookback and a 720-day lookback are not small variations of the same thing — a 720-day lookback can require AEP to evaluate two years of event history for every profile in scope.
That matters for batch performance, but it also matters for journey freshness. Adobe’s streaming segmentation guidance places strict limits on event lookback behavior; long historical windows are a strong signal that an audience is not suitable for real-time qualification and needs closer review before it powers a journey trigger.
2. Lookup joins: 0–20 points
Every distinct join to a separate lookup class has to be resolved during evaluation, and those joins stack. Resolving purchase events through a product hierarchy or custom lookup dataset can create an enormous amount of work across a large audience run.
Lookup joins are often necessary. The problem is that practitioners rarely see their cost at creation time. The score makes that cost visible.
3. Aggregation: 0–20 points
Aggregations are one of the most common ways an audience quietly becomes expensive. “Has purchased from this department” is relatively simple. “Has spent more than $150 across purchases in this department over the last 720 days, excluding returns” is very different.
A sum, average, or count over an event set usually means the full qualifying set must be gathered and evaluated before membership can be decided. That is often the exact moment when a profile-level computed attribute would be the better architectural choice. Adobe computed attributes are designed to aggregate event-level data into profile-level attributes that can then be used across segmentation, activation, and personalization.
4. Merge policy complexity: 0–10 points
Multiple merge policies in a single audience mean AEP is stitching identity under different rules for different schema components inside one evaluation. That is overhead — and it is also a signal worth a second look.
The score counts the distinct merge policies an audience depends on. A higher count is a prompt, not a verdict: review whether the audience is using the right identity context for where the business intends to use it.
That review matters most when an audience is headed for real-time or edge personalization, which carry their own merge-policy requirements. For example, an audience can only be activated on edge if it is tied to a merge policy marked active-on-edge, and a sandbox can have only one such policy. A high merge-policy contribution is a good reason to confirm the audience is configured for the tier it is meant to serve before it drives a customer-facing experience.
5. Negation and exclusion: 0–5 points
Negation-heavy logic deserves its own signal. NOT IN, does-not-exist, and exclusion containers often cannot short-circuit on a simple positive match — they tend to require broader scans, more careful evaluation, and more operational scrutiny.
This matters especially for suppression audiences. When teams model suppression as a custom audience — instead of, or in addition to, native consent and suppression controls — a batch-bound exclusion audience may lag recent preference changes. That is not just a performance issue. It can become a consent, deliverability, and customer experience issue. The score helps identify the exclusion audiences most likely to need review.
6. Nested-reference depth: 0–10 points
Nested audience references are both a cost issue and a governance issue. An audience built on an audience built on another audience may be efficient from a reuse standpoint, but it also creates dependency chains that are hard to see and harder to govern.
A change made upstream can silently change the population of a downstream journey, campaign, or activation — even when nobody touched the journey itself. Adobe tooling may understand parent and child dependencies for audience lifecycle management, but it does not turn deep audience chains into a plain-language blast-radius score. That is what this signal is designed to expose.
Why base population is not in the score
A note for the practitioners who read the original investigation closely: base population size was a cost factor in that story. It is a real one. But we deliberately left it out of the score.
Why? Because a live population count changes after every segmentation run. If the score depended on population size, MiaProva would need to poll AEP for every audience, every day, across every tenant — thousands of extra calls, turning a preventive score into a runtime-dependent metric. That is not what this feature is meant to be.
The value of Audience Complexity Scoring is that it reads the definition and nothing else. Base population is still tracked in MiaProva’s Audience Activation Runs data. It just does not belong inside a score whose purpose is to compute instantly at creation or modification time.
Why it multiplies, not just adds
The six signals create a raw score. But AEP cost factors do not behave as if they simply add together — they compound. A long lookback is costly. A long lookback plus a lookup join is worse. A long lookback plus a lookup join plus a filtered aggregation is disproportionately worse, because each factor amplifies the work created by the others.
So the score applies a compounding multiplier when three or more signals are individually elevated. When that happens, the total is multiplied by 1.25 and capped at 100.
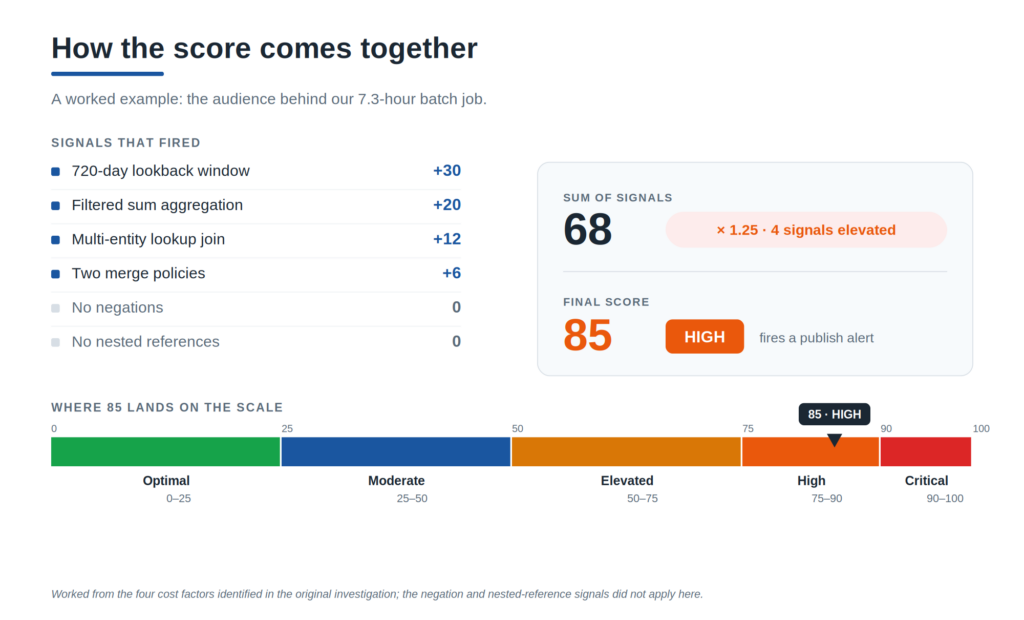
The final score maps to five bands: Optimal (0–24), Moderate (25–49), Elevated (50–74), High (75–89), and Critical (90–100). High and Critical scores trigger alerts; Critical scores are also eligible for pre-batch forecasting.
The goal is not just to say “this audience looks complex.” The goal is to make the complexity operational.
The batch window is just where we noticed it first
The more interesting shift came when we stopped thinking about the score only as a batch-monitoring feature.
Strip the score down to what it actually measures, and it becomes an index of two things: how expensive an audience is to evaluate, and how far that audience likely sits from real-time usefulness. The signals that make an audience costly to compute — long lookbacks, aggregations, joins, nested dependencies, exclusions — are also the signals that often make it less appropriate for streaming, edge, or journey-trigger use cases.
That does not mean the score replaces Adobe’s own evaluation method. It does not — AEP eligibility still depends on Adobe’s specific evaluation rules, and those rules can change over time. But as an early-warning signal, the score is extremely useful. It tells you where to look before the audience is wired into something customer-facing.
What the score means for Journey Optimizer
If you run Adobe Journey Optimizer on top of RT-CDP, audiences are the fuel for your journeys. They determine entry criteria, exit criteria, suppression, branches, personalization, and targeting. And AJO deliberately pushes audience usage closer to campaign and journey managers — people who may never see the underlying audience definition, much less its evaluation cost. That is exactly where a complexity score earns its keep.
Real-time journey readiness
A journey keyed on audience qualification is only as fresh as the audience feeding it. A high-scoring audience is much less likely to be appropriate as a real-time trigger — it may depend on batch evaluation, long historical windows, joins, or aggregations that make it a poor fit for immediate customer response.
This matters even more now. Starting in August 2026, Adobe Journey Optimizer will block publication for any journey that uses a batch audience in an Audience Qualification node. Existing live journeys are not automatically stopped, but new, draft, and duplicated journeys with this configuration must be updated before they can be published.
That makes complexity scoring more than an observability feature — it becomes a pre-publish readiness check. Before a marketer wires an audience into an Audience Qualification journey, MiaProva can flag: “This audience may not be suitable for real-time journey entry. Review its evaluation method and complexity before using it as a trigger.”
And it points to the fix. When an audience is batch-bound, the answer is not to force it into a real-time node. Adobe’s own guidance is to route batch audiences through a Read Audience activity — designed for scheduled, batch use — rather than Audience Qualification. If the business genuinely needs real-time entry, that is the cue to move the math upstream so the audience becomes simple enough to qualify via streaming. The complexity score is what tells you which bucket an audience is in before you wire it up.
That is a very different conversation than discovering the issue after a journey fails validation or behaves slower than expected.
Suppression freshness
Suppression is one of the most important use cases for this score. Many teams use audiences to exclude customers from journeys, campaigns, offers, or channels. Sometimes that is appropriate. But when suppression depends on custom audience logic, the freshness of that audience matters.
If an exclusion audience is batch-bound, negation-heavy, or dependent on stale inputs, it may not reflect the latest opt-outs, preference changes, or customer actions. Native consent and suppression controls should always be part of the architecture — but many enterprise implementations also contain custom suppression audiences layered on top of those controls. Those are the audiences MiaProva should help teams inspect.
A high negation score does not mean the audience is wrong. It means the audience deserves attention, because stale suppression logic can become more than a runtime inconvenience. It can become a compliance, deliverability, and customer-trust problem.
Blast radius and silent drift
Nested audience references are another AJO risk. Imagine a journey that uses Audience C. Audience C depends on Audience B. Audience B depends on Audience A. A practitioner updates Audience A for a completely different campaign — and suddenly the journey using Audience C may be targeting a different population, even though nobody edited the journey.
That is silent drift. The nested-reference-depth signal turns that invisible dependency chain into something a team can actually govern. It lets you ask: Which live journeys depend on deeply nested audiences? Which upstream audiences have the largest downstream blast radius? Which base audiences should require approval before edits? Which references should be flattened or refactored?
That is not just optimization. That is change management.
Identity and personalization review
Audience complexity can also point to identity-context risk. If an audience depends on a merge-policy configuration or identity pattern that is not aligned with the destination, channel, or journey, the business may see unexpected personalization or qualification behavior. This is especially important when an audience is used for customer-facing orchestration.
The score should trigger a review: Is the audience using the right identity context? Is the merge policy appropriate for the destination? Is this intended for batch, streaming, or edge usage — and if edge, is it tied to an active-on-edge merge policy? Does the journey depend on a profile view that differs from the audience evaluation context?
The score does not answer all of those questions automatically. But it tells the team which audiences are worth asking about.
Governance: a cost signal marketers can actually see
RT-CDP and AJO were designed to democratize audience building. That is a good thing. It is also exactly why audience sprawl and quiet cost accumulation are so common. A campaign manager can build an audience without knowing whether it is cheap, expensive, real-time-ready, batch-bound, deeply nested, or dependent on heavy aggregation logic. AEP gives teams powerful audience-building capabilities, but it rarely gives the builder a simple cost signal at the moment of creation.
A 0–100 score changes that. It shifts governance left. Instead of waiting for an architect, platform owner, or operations team to review everything manually, the builder gets immediate feedback: “This audience is High complexity.” “This audience uses a 720-day lookback.” “This audience contains an aggregation that could be moved upstream.” “This audience depends on three levels of nested references.” That is the kind of feedback that changes behavior.
Across a portfolio, the score becomes a shared vocabulary for audits. You can sort the inventory by score. You can identify expensive audiences that are rarely activated. You can find high-scoring audiences used in journeys. You can isolate complex suppression logic. You can spot teams or brands whose audience complexity is trending upward over time.
For multi-brand organizations running many teams in the same sandbox, that matters — it creates a consistent standard without requiring a human review of every definition. It also becomes an onboarding tool. Nothing teaches a new practitioner what “expensive” looks like faster than watching the score move as they build.
Architecture: the score tells you what belongs upstream
When a real-time journey needs an audience that scores High or Critical, that is not just a warning. It is a diagnosis. It usually means the audience is doing too much work in the wrong tier.
The fix is the thesis of the earlier remediation post: move the math upstream. If the audience needs a 720-day spend calculation, do not make the audience calculate that from raw events every time. Precompute the value into a profile attribute or computed attribute. Then the runtime audience becomes simple:
profile.departmentXNetSpend720d > 150
That is easier to evaluate, easier to govern, easier to explain, and more likely to be usable in the places the business actually wants to use it.
The per-signal breakdown tells you what kind of refactor is needed.
| Signal that spikes | What it usually means | Better architectural pattern |
|---|---|---|
| Long lookback | Too much event history is being scanned | Shorten the window or precompute the historical value |
| Aggregation | Runtime math is happening inside the audience | Move the calculation to a computed/profile attribute |
| Lookup join | The audience depends on multi-entity resolution | Flatten key attributes upstream where possible |
| Negation/exclusion | Suppression or absence logic may be stale or costly | Review native consent/suppression controls and refresh needs |
| Nested references | Hidden dependencies create blast-radius risk | Refactor into simpler base audiences or document dependencies |
| Merge policy complexity | Audience may not fit the intended activation tier | Review merge policy, evaluation method, and destination requirements |
This is where the score becomes especially useful for architects. It does not just say “this audience is expensive.” It says “this audience is in the wrong tier for how you want to use it.” That is a much more actionable insight.
One signal, many readouts
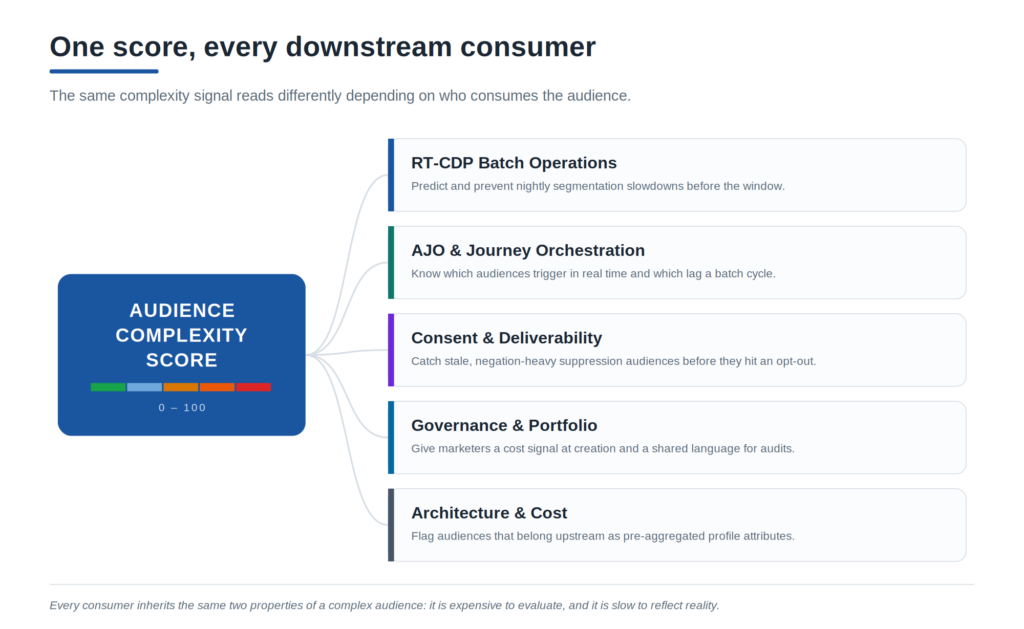
Pull it all together and the point is simple: the same six signals that predict batch cost also predict journey risk, governance exposure, and architectural debt. One definition can be read multiple ways.
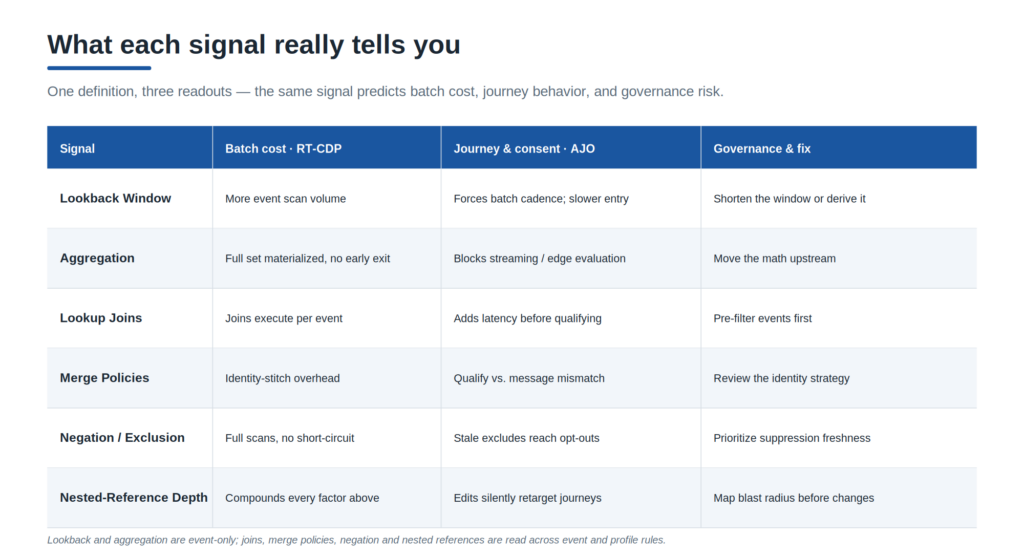
For batch operations, the score answers: “Which audience is likely to slow tonight’s segmentation run?” For Journey Optimizer, it answers: “Which audiences are risky as real-time journey triggers or suppressions?” For governance teams, it answers: “Where is complexity accumulating across the portfolio?” For architects, it answers: “What logic should be moved upstream?”
That is why this is more than a monitoring feature. It is a shared operating model for audience quality.
Where you see it in MiaProva
The score appears wherever the decision gets made.
In the segment inventory, it appears as a column set, so complexity is visible across the full audience portfolio at a glance. In the segment detail view, it appears as a full per-signal breakdown, including targeted recommendations and estimated point reductions. In the alerts framework, it becomes proactive: a newly published definition scoring 75 or higher can fire an alert within minutes, ahead of the next batch window. Complexity scores also feed correlation alerts (a runtime spike lining up with a high-scoring publish) and trend alerts (org-wide complexity creeping up over a rolling window).
That last one matters more than people think. Audience complexity does not usually explode all at once. It creeps. One team adds a longer lookback. Another adds a nested dependency. Another builds a custom suppression audience. Another joins to a lookup dataset. Individually, each choice seems reasonable. Collectively, they become platform debt. The score gives teams a way to see that debt before it becomes an incident.
What this unlocks for AI and MCP tooling
There is a forward-looking angle here too. Because the score is structured and per-audience, it is exactly the kind of signal an AI agent can reason over. As MiaProva extends its MCP tooling, teams should be able to ask questions like:
“Show me my riskiest audiences.” “Which suppression audiences are most likely to be stale?” “Which audiences should not be used as AJO qualification triggers?” “Why is this journey slow to trigger?” “Which high-complexity audiences could be simplified with computed attributes?” “What changed before last night’s batch runtime spike?” “Which audiences have the largest downstream blast radius?”
The complexity score becomes the evidence layer beneath those answers. The AI does not have to guess — it can point to the definition, the signal contributions, the publish time, the activation history, the journey usage, and the recommended refactor. That is the difference between a chatbot and an observability assistant.
Preventive, not diagnostic
That is the whole point. Credit Segment 4 was created roughly 16 hours before the batch job it slowed. If it had been scored at creation, flagged, and surfaced to the team that afternoon, the conversation could have happened before the seven-hour job — not after it.
Now multiply that by every downstream consumer of an audience. The same score that helps protect the batch window can also prevent a marketer from using a batch-bound audience as a real-time trigger, surface suppression audiences that deserve a freshness review, identify nested dependencies before an upstream edit changes a live journey, give practitioners a cost signal while they are building, tell architects which calculations belong upstream, and give operations teams a portfolio-level view of audience debt.
AEP can tell you what an audience produces. It can expose evaluation method, population, and related operational metadata. But it does not give every practitioner a simple, pre-publication score that explains what the audience costs, how fresh it is likely to be, and what it may put at risk.
That gap does not only live in the batch job. It lives everywhere audiences are consumed. That is exactly where we built for.
MiaProva is an AEP observability, monitoring, and optimization management platform built for teams running Adobe Experience Platform and Journey Optimizer at enterprise scale. Learn more at miaprova.com.